6
$\begingroup$

You can get my data by this code

{data1, data2} = Uncompress[FromCharacterCode@
   Flatten[ImageData[Import["https://i.sstatic.net/ShSMY.png"], "Byte"]]];

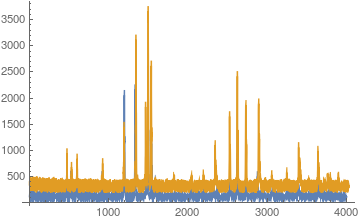
We can show it with ListLinePlot

ListLinePlot[{data1, data2}, PlotRange -> All]

plot

Note the peaks of data1 and data2 is not same totally.I want to calculate the amount of offset in x-axis direction after we align data1 and data2 as far as possible.This current try

offset = Length[data1] - 
   SmithWatermanSimilarity @@ (PeakDetect[Last /@ #] & /@ {data1,data2});
First[Commonest[Differences[First /@ data1]]]*offset

17.4

As we can see,the error is very big.I think two diffcult in this solution result to this

  • The x-interval is not exactly same.

    Union[Differences[First /@ data1]]
    

    {0.01,0.02,0.02,0.02,0.02,0.02,0.03,0.03}(*funny to get so many 0.02.*)

  • The peak is not exactly same.

Is there any better method can do this?

$\endgroup$

2 Answers 2

6
+50
$\begingroup$

Could also use ListCorrelate.

{data1, data2} = 
  Uncompress[
   FromCharacterCode@
    Flatten[ImageData[Import["https://i.sstatic.net/ShSMY.png"], 
      "Byte"]]];

We remove the x axis values for now.

data1b = data1[[All, 2]];
data2b = data2[[All, 2]];
lc = 
  Reverse[Chop[ListCorrelate[data1b, data2b, {-1, -1}, 0]]];
maxPos = Ordering[lc, -1][[1]]

(* Out[98]= 33 *)

So we want to push the second set by 33-1 = 32 units along the +x axis. We'll see how that looks.

ListLinePlot[{data1b, Join[Take[data2b, maxPos - 1], data2b]}, 
 PlotRange -> All]

enter image description here

One might wish to preprocess to remove the lower values, and possibly clip high ones. I used the code below for that purpose. In this case it did not change the outcome.

reScale[data_] := Module[{mn = Mean[data], newd},
  newd = Clip[Threshold[data - Mean[data], mn/2], {0, mn/2}]]

data1c = reScale[data1b];
data2c = reScale[data2b];

--- edit ---

I should remark that what I did is quite similar to the (arguably more scientific) approach shown by @mikado. If I did not zero-pad the ListCorrelate the list plot would be identical, up to a constant scale factor, to that of cc in the @mikado response.

--- end edit ---

$\endgroup$
2
  • $\begingroup$ ListCorrelate is a simpler approach in this case and I recommend this answer $\endgroup$
    – mikado
    Commented Apr 6, 2017 at 11:31
  • $\begingroup$ It's simpler, yes, but I'm not sure it is quite correct at least in padding choice. I think one can argue that it works well provided the "correct" shift is small relative to the number of points. $\endgroup$ Commented Apr 6, 2017 at 14:11
5
$\begingroup$

We can use Fourier techniques (cross-correlation) to estimate a misalignment between the signals.

Import the data

{data1, data2} = 
  Uncompress[
   FromCharacterCode@
    Flatten[ImageData[Import["https://i.sstatic.net/ShSMY.png"], 
      "Byte"]]];

The sample times associated with the two signals are the same

(First /@ data1) === (First /@ data2)
(* True *)

The sampling rate is close enough to uniform not to cause problems. The average sample interval is given by

dt = Mean[Differences[First /@ data1]]
(* 0.02 *)

Compute spectra, subtracting off the pedestal first.

spec[u_List] := Fourier[u - Median[u]]
spec1 = spec[Last /@ data1];
spec2 = spec[Last /@ data2];

Now compute the cross-correlation

cc = InverseFourier[Conjugate[spec2] spec1];

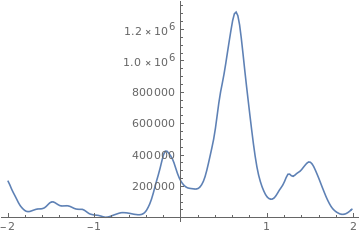
The cross-correlation has a clear peak

ListLinePlot[
 Transpose[{Range[-100, 99] dt, 
   Abs[Join[Take[cc, -100], Take[cc, 100]]]}], PlotRange -> All]

Cross-correlation peak

This suggests that the delay is given by about

delay = First[First[(Position[Abs[cc], Max[Abs[cc]]] - 1) dt]]
(* 0.64 *)

Apply this delay to the data

shift[u_List, t_] := {t, 0} + # & /@ u
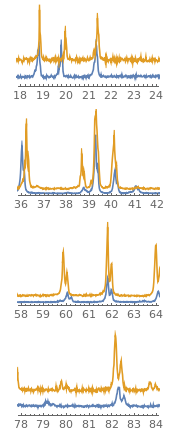
graph = ListLinePlot[{shift[data1, -32 dt], data2}, PlotRange -> All];
GraphicsColumn[{
  Show[graph, PlotRange -> {{18, 24}, {0, 1000}}], 
  Show[graph, PlotRange -> {{36, 42}, {0, 3500}}], 
  Show[graph, PlotRange -> {{58, 64}, {0, 2500}}],
  Show[graph, PlotRange -> {{78, 84}, {0, 1000}}]}]

Aligned sequences

We can see that the alignment is not perfect - it looks as if the delay may be somewhat variable.

$\endgroup$
3
  • $\begingroup$ Just an ask,this is your site? $\endgroup$
    – yode
    Commented Apr 5, 2017 at 20:52
  • $\begingroup$ No, I'm afraid I don't recognise any of the characters on that site! $\endgroup$
    – mikado
    Commented Apr 5, 2017 at 20:56
  • $\begingroup$ Just make a note,MaximalBy[Cases[plot, _Line, Infinity][[1, 1]], Last] also can give 0.64.This is a wonderful answer for me.I will accept it after some opening time.Thanks very very much. $\endgroup$
    – yode
    Commented Apr 5, 2017 at 21:17

Your Answer

By clicking “Post Your Answer”, you agree to our terms of service and acknowledge you have read our privacy policy.

Not the answer you're looking for? Browse other questions tagged or ask your own question.