2
$\begingroup$

I have to plot this trigonometric function:

    v1[y1_, y2_] := 7.6 NIntegrate[-(1/Sqrt[(x1 - y1)^2 + (-y2)^2]) 2/(4 Pi^2)
                  (0.71 Cos[a + ArcTan[y2/(y1 - x1)]]^2 Sin[a + ArcTan[y2/(y1 - x1)]] - 
                   0.5 Sin[a + ArcTan[y2/(y1 - x1)]]^3)/(Sin[a + ArcTan[y2/( y1 - x1)]]^4 
                  (Cot[a + ArcTan[y2/(y1 - x1)]]^2 - 0.26 + 0.51 I) 
                  (Cot[a + ArcTan[y2/(y1 - x1)]]^2 - 0.26 -0.51 I)) 1/Cos[a],
                  {a, 0, Pi}, {x1, 1 , 2}, MaxRecursion -> 4]

if I do a ContourPlotof the real part of the function like

ContourPlot[Re[v1[y1,y2]],{y1,0,5},{y2,0,5}]

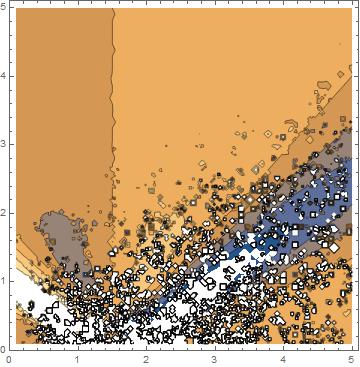
I obtain something like this with some white voids

enter image description here

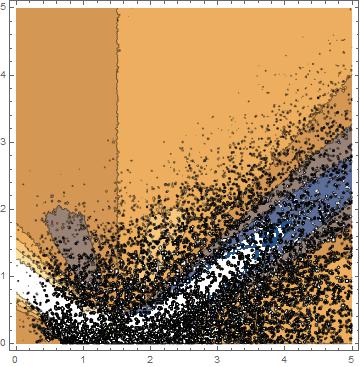
So, after reading How to plot the contour of f[x,y]==0 if always f[x,y]>=0 I increased the MaxRecursion and PlotPoint (here only two of of those made), but the problem remain.

 ContourPlot[Re[v1[y1,y2]],{y1,0,5},{y2,0,5},MaxRecursion->1,PlotPoint->100]

enter image description here

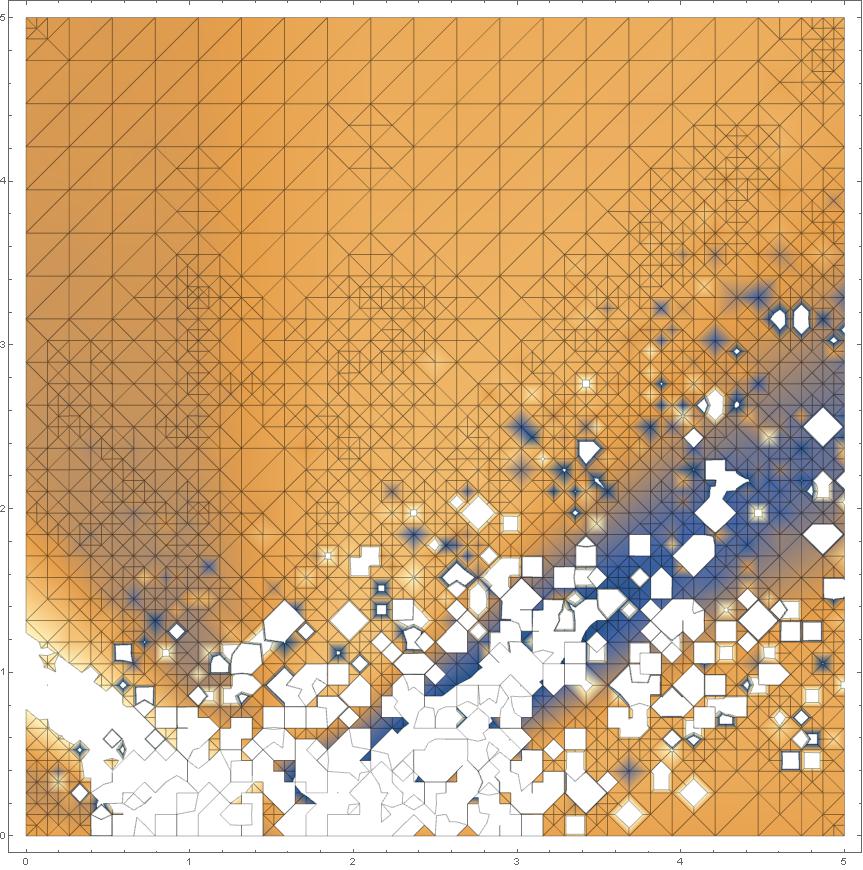
ContourPlot[Re[v1[y1,y2]],{y1,0,5},{y2,0,5},MaxRecursion->2,PlotPoint->20,Mesh->All]

enter image description here

Here I can see is a problem of the mesh. I tried many combination of MaxRecursion and PlotPoints, but I can't find a solution.I only have to increase more? Because I tried a MR->2, PP->100 but after 2 days Mathematica didn't give me a result. So I ask you if there is a method to parallelize it?

EDIT: Sorry I didn't talk about the regularization of my function! I took the integrand argoument without 1/Cos[a]

g[b_]= (0.71 Cos[b]^2 Sin[b] -  0.5 Sin[b]^3)/(Sin[b]^4(Cot[b]^2 - 0.26 + 0.51 I)(Cot[b]^2 - 0.26 -0.51 I))

and I regularized it with

(g[a+ ArcTan[y2/(y1 - x1)]] - g[ArcTan[y2/(y1 - x1)] + Pi/2] -
g'[ArcTan[y2/(y1 - x1)] + Pi/2] (a - Pi/2)) (1/Cos[a])

So in a=Pithe function doesn't diverge

$\endgroup$

1 Answer 1

5
$\begingroup$

You should never get to the point where you are sending a function like this to Plot or ContourPlot until you've verified that it works, and works in a reasonable amount of time. If it takes forever to evaluate but it does evaluate reliably, then you should create a list and use the corresponding ListPlot.

g = (0.71 Cos[#]^2 Sin[#] - 
      0.5 Sin[#]^3)/(Sin[#]^4 (Cot[#]^2 - 0.26 + 0.51 I) (Cot[#]^2 - 
        0.26 - 0.51 I)) &;
integrand[y1_, y2_, x1_, 
   a_] = (g[a + ArcTan[y2/(y1 - x1)]] - 
     g[ArcTan[y2/(y1 - x1)] + Pi/2] - 
     g'[ArcTan[y2/(y1 - x1)] + Pi/2] (a - Pi/2)) (1/Cos[a]);

v1[y1_?NumericQ, y2_?NumericQ, intopts : OptionsPattern[]] := 
 7.6 NIntegrate[integrand[y1, y2, x1, a], {a, 0, Pi}, {x1, 1, 2},
   Evaluate[FilterRules[{intopts}, Options[NIntegrate]]]]

Notice the v1 function takes options for NIntegrate, which allows you to tweak things like MaxRecursions or WorkingPrecision if you wish to. Next make a 2D list of values

dx = 5/35.(*Set this to a smaller value,like 0.05 for a better plot*);

Monitor[twodlist = 
   Table[Quiet@v1[y1, y2, MaxRecursion -> 5], {y2, 0, 5, dx}, {y1, 0, 
     5, dx}];, {y1, y2}]

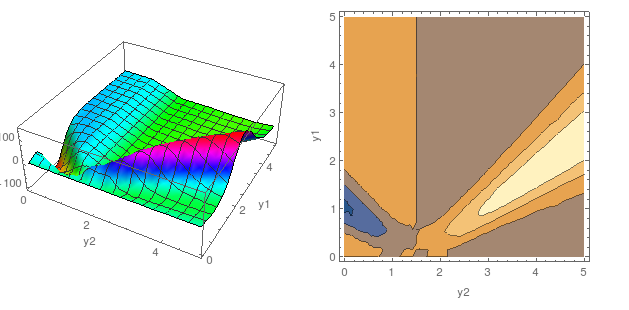
GraphicsRow[{ListPlot3D[Re@twodlist, PlotRange -> All, 
   DataRange -> {{0, 5}, {0, 5}}, AxesLabel -> {"y2", "y1"}, 
   ColorFunction -> Hue], 
  ListContourPlot[Re[twodlist], PlotRange -> All, 
   DataRange -> {{0, 5}, {0, 5}}, FrameLabel -> {"y2", "y1"}]}, 
 ImageSize -> 600]

enter image description here

$\endgroup$

Your Answer

By clicking “Post Your Answer”, you agree to our terms of service and acknowledge you have read our privacy policy.

Not the answer you're looking for? Browse other questions tagged or ask your own question.