deleted 2001 characters in body
Source Link
Jason B.
  • 70.2k
  • 3
  • 144
  • 298

This isn't a plotting problem at all, this is a problem with the numerical integration. You have 2 issues with the numerical integral. First, your integral diverges when a=π due to the 1/Cos[a] term. Second, the integrand has a discontinuity when y1=x1 caused by your ArcTan calls:

Plot[ArcTan[1/(1 - x)], {x, 0, 2}]

enter image description here

Both of these are serious issues for the NIntegrate I would think.

You should never get to the point where you are sending a function like this to Plot or ContourPlot until you've verified that it works, and works in a reasonable amount of time. If it takes forever to evaluate but it does evaluate reliably, then you should create a list and use the corresponding ListPlot.

You mentioned changing the MaxRecursions to a higher number, let's see what effect that has. Here I am making a table where I range the value of MaxRecursion between 1 and 40. See that the results change dramatically depending on this value, and even in the end when it stabilizes, I don't know if I trust it.

enter image description here

So you need to somehow get the integrand into a form that doesn't diverge as a function of a, and doesn't have a dramatic discontinuity when x1=y1.

But it is possible to make a plot here - whether you trust the results is up to you. First generate a 2D list,

Monitor[twodlistg = (0.71 Cos[#]^2 Sin[#] - 
  Table[Quiet@v1[y1, y2, 30], {y2, 0, .5, .2},Sin[#]^3)/(Sin[#]^4 {y1,(Cot[#]^2 - 0,.26 5,+ 0.2}];,{y1,y2}]

Note I wrapped the Table call in Monitor, so that you can see how fast it is going and whether you should go get coffee or just wait a minute. I also used Quiet so as to ignore convergence error messages. Now if you have a worse error, a so-called "Catastrophic" error, where NIntegrate can't give a result, then that message will still come through.

Now you plot the 2D list you made,

{ListPlot3D[Re@twodlist,51 PlotRangeI) ->(Cot[#]^2 All,- 
  DataRange      0.26 -> {{0,.51 5}I)) &;
integrand[y1_, {0y2_, 5}}x1_, InterpolationOrder
   a_] = (g[a + ArcTan[y2/(y1 -> 2,x1)]] - 
  AxesLabel -> {"y2", "y1"}g[ArcTan[y2/(y1 - x1)], + Pi/2] - 
 ListContourPlot[Re[twodlist], PlotRange   g'[ArcTan[y2/(y1 -> Allx1)] + Pi/2] (a - Pi/2)) (1/Cos[a]);

v1[y1_?NumericQ, y2_?NumericQ, intopts : OptionsPattern[]] := 
 7.6 DataRangeNIntegrate[integrand[y1, ->y2, {{0x1, 5}a], {a, 0, 5}Pi}, InterpolationOrder{x1, ->1, 2}, 
  FrameLabel -> Evaluate[FilterRules[{"y2"intopts}, "y1"}]}Options[NIntegrate]]]]

enter image description here

But again Notice the v1 function takes options for NIntegrate, I thinkwhich allows you should go back to the integrand and seetweak things like MaxRecursions or WorkingPrecision if there is something you can do to make it easier to integrate.

Edit

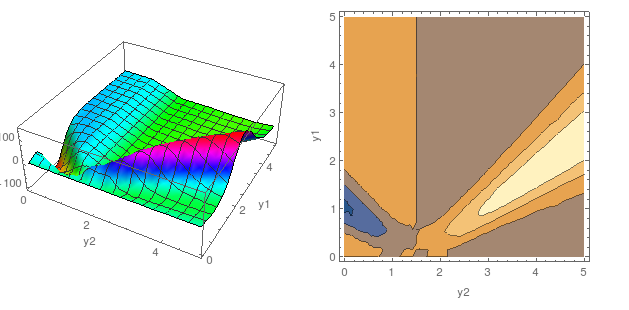
Now that the problem with the integrand is fixed, I think it is relatively easywish to plot. It seems that we only need a MaxRecursion value of 5 now. Again, I think it's a good idea to build Next make a 2D list of values on a grid and then plot that list, for the simple reason that you can then change the plotting options and replot in no time.

With the new function defined here, (I have to leave work for the day or I'd format this answer better)

dx = 05/35.2(* Set*Set this to a smaller value, like 0.05 for a better plot*);

Monitor[twodlist = 
   Table[Quiet@v1[y1, y2, MaxRecursion -> 5], {y2, 0, 5, .2dx}, {y1, 0, 
     5, .2dx}];, {y1, y2}]

GraphicsRow[{ListPlot3D[Re@twodlist, PlotRange -> All, 
   DataRange -> {{0, 5}, {0, 5}}, InterpolationOrderAxesLabel -> 2{"y2", "y1"}, 
   AxesLabelColorFunction -> {"y2", "y1"}]Hue], 
  ListContourPlot[Re[twodlist], PlotRange -> All, 
   DataRange -> {{0, 5}, {0, 5}}, InterpolationOrder -> 2, 
   FrameLabel -> {"y2", "y1"}]}, 
 ImageSize -> 600]

enter image description hereenter image description here

This isn't a plotting problem at all, this is a problem with the numerical integration. You have 2 issues with the numerical integral. First, your integral diverges when a=π due to the 1/Cos[a] term. Second, the integrand has a discontinuity when y1=x1 caused by your ArcTan calls:

Plot[ArcTan[1/(1 - x)], {x, 0, 2}]

enter image description here

Both of these are serious issues for the NIntegrate I would think.

You should never get to the point where you are sending a function like this to Plot or ContourPlot until you've verified that it works, and works in a reasonable amount of time. If it takes forever to evaluate but it does evaluate reliably, then you should create a list and use the corresponding ListPlot.

You mentioned changing the MaxRecursions to a higher number, let's see what effect that has. Here I am making a table where I range the value of MaxRecursion between 1 and 40. See that the results change dramatically depending on this value, and even in the end when it stabilizes, I don't know if I trust it.

enter image description here

So you need to somehow get the integrand into a form that doesn't diverge as a function of a, and doesn't have a dramatic discontinuity when x1=y1.

But it is possible to make a plot here - whether you trust the results is up to you. First generate a 2D list,

Monitor[twodlist = 
  Table[Quiet@v1[y1, y2, 30], {y2, 0, 5, .2}, {y1, 0, 5, .2}];,{y1,y2}]

Note I wrapped the Table call in Monitor, so that you can see how fast it is going and whether you should go get coffee or just wait a minute. I also used Quiet so as to ignore convergence error messages. Now if you have a worse error, a so-called "Catastrophic" error, where NIntegrate can't give a result, then that message will still come through.

Now you plot the 2D list you made,

{ListPlot3D[Re@twodlist, PlotRange -> All, 
  DataRange -> {{0, 5}, {0, 5}}, InterpolationOrder -> 2, 
  AxesLabel -> {"y2", "y1"}],
 ListContourPlot[Re[twodlist], PlotRange -> All, 
  DataRange -> {{0, 5}, {0, 5}}, InterpolationOrder -> 2, 
  FrameLabel -> {"y2", "y1"}]}

enter image description here

But again, I think you should go back to the integrand and see if there is something you can do to make it easier to integrate.

Edit

Now that the problem with the integrand is fixed, I think it is relatively easy to plot. It seems that we only need a MaxRecursion value of 5 now. Again, I think it's a good idea to build a list of values on a grid and then plot that list, for the simple reason that you can then change the plotting options and replot in no time.

With the new function defined here, (I have to leave work for the day or I'd format this answer better)

dx = 0.2(* Set this to a smaller value, like 0.05 for a better plot*);

Monitor[twodlist = 
   Table[Quiet@v1[y1, y2, MaxRecursion -> 5], {y2, 0, 5, .2}, {y1, 0, 
     5, .2}];, {y1, y2}]

GraphicsRow[{ListPlot3D[Re@twodlist, PlotRange -> All, 
   DataRange -> {{0, 5}, {0, 5}}, InterpolationOrder -> 2, 
   AxesLabel -> {"y2", "y1"}], 
  ListContourPlot[Re[twodlist], PlotRange -> All, 
   DataRange -> {{0, 5}, {0, 5}}, InterpolationOrder -> 2, 
   FrameLabel -> {"y2", "y1"}]}, ImageSize -> 600]

enter image description here

You should never get to the point where you are sending a function like this to Plot or ContourPlot until you've verified that it works, and works in a reasonable amount of time. If it takes forever to evaluate but it does evaluate reliably, then you should create a list and use the corresponding ListPlot.

g = (0.71 Cos[#]^2 Sin[#] - 
      0.5 Sin[#]^3)/(Sin[#]^4 (Cot[#]^2 - 0.26 + 0.51 I) (Cot[#]^2 - 
        0.26 - 0.51 I)) &;
integrand[y1_, y2_, x1_, 
   a_] = (g[a + ArcTan[y2/(y1 - x1)]] - 
     g[ArcTan[y2/(y1 - x1)] + Pi/2] - 
     g'[ArcTan[y2/(y1 - x1)] + Pi/2] (a - Pi/2)) (1/Cos[a]);

v1[y1_?NumericQ, y2_?NumericQ, intopts : OptionsPattern[]] := 
 7.6 NIntegrate[integrand[y1, y2, x1, a], {a, 0, Pi}, {x1, 1, 2},
   Evaluate[FilterRules[{intopts}, Options[NIntegrate]]]]

Notice the v1 function takes options for NIntegrate, which allows you to tweak things like MaxRecursions or WorkingPrecision if you wish to. Next make a 2D list of values

dx = 5/35.(*Set this to a smaller value,like 0.05 for a better plot*);

Monitor[twodlist = 
   Table[Quiet@v1[y1, y2, MaxRecursion -> 5], {y2, 0, 5, dx}, {y1, 0, 
     5, dx}];, {y1, y2}]

GraphicsRow[{ListPlot3D[Re@twodlist, PlotRange -> All, 
   DataRange -> {{0, 5}, {0, 5}}, AxesLabel -> {"y2", "y1"}, 
   ColorFunction -> Hue], 
  ListContourPlot[Re[twodlist], PlotRange -> All, 
   DataRange -> {{0, 5}, {0, 5}}, FrameLabel -> {"y2", "y1"}]}, 
 ImageSize -> 600]

enter image description here

added 1141 characters in body
Source Link
Jason B.
  • 70.2k
  • 3
  • 144
  • 298

Edit

Now that the problem with the integrand is fixed, I think it is relatively easy to plot. It seems that we only need a MaxRecursion value of 5 now. Again, I think it's a good idea to build a list of values on a grid and then plot that list, for the simple reason that you can then change the plotting options and replot in no time.

With the new function defined here, (I have to leave work for the day or I'd format this answer better)

dx = 0.2(* Set this to a smaller value, like 0.05 for a better plot*);

Monitor[twodlist = 
   Table[Quiet@v1[y1, y2, MaxRecursion -> 5], {y2, 0, 5, .2}, {y1, 0, 
     5, .2}];, {y1, y2}]

GraphicsRow[{ListPlot3D[Re@twodlist, PlotRange -> All, 
   DataRange -> {{0, 5}, {0, 5}}, InterpolationOrder -> 2, 
   AxesLabel -> {"y2", "y1"}], 
  ListContourPlot[Re[twodlist], PlotRange -> All, 
   DataRange -> {{0, 5}, {0, 5}}, InterpolationOrder -> 2, 
   FrameLabel -> {"y2", "y1"}]}, ImageSize -> 600]

enter image description here

Edit

Now that the problem with the integrand is fixed, I think it is relatively easy to plot. It seems that we only need a MaxRecursion value of 5 now. Again, I think it's a good idea to build a list of values on a grid and then plot that list, for the simple reason that you can then change the plotting options and replot in no time.

With the new function defined here, (I have to leave work for the day or I'd format this answer better)

dx = 0.2(* Set this to a smaller value, like 0.05 for a better plot*);

Monitor[twodlist = 
   Table[Quiet@v1[y1, y2, MaxRecursion -> 5], {y2, 0, 5, .2}, {y1, 0, 
     5, .2}];, {y1, y2}]

GraphicsRow[{ListPlot3D[Re@twodlist, PlotRange -> All, 
   DataRange -> {{0, 5}, {0, 5}}, InterpolationOrder -> 2, 
   AxesLabel -> {"y2", "y1"}], 
  ListContourPlot[Re[twodlist], PlotRange -> All, 
   DataRange -> {{0, 5}, {0, 5}}, InterpolationOrder -> 2, 
   FrameLabel -> {"y2", "y1"}]}, ImageSize -> 600]

enter image description here

Source Link
Jason B.
  • 70.2k
  • 3
  • 144
  • 298

This isn't a plotting problem at all, this is a problem with the numerical integration. You have 2 issues with the numerical integral. First, your integral diverges when a=π due to the 1/Cos[a] term. Second, the integrand has a discontinuity when y1=x1 caused by your ArcTan calls:

Plot[ArcTan[1/(1 - x)], {x, 0, 2}]

enter image description here

Both of these are serious issues for the NIntegrate I would think.

You should never get to the point where you are sending a function like this to Plot or ContourPlot until you've verified that it works, and works in a reasonable amount of time. If it takes forever to evaluate but it does evaluate reliably, then you should create a list and use the corresponding ListPlot.

You mentioned changing the MaxRecursions to a higher number, let's see what effect that has. Here I am making a table where I range the value of MaxRecursion between 1 and 40. See that the results change dramatically depending on this value, and even in the end when it stabilizes, I don't know if I trust it.

enter image description here

So you need to somehow get the integrand into a form that doesn't diverge as a function of a, and doesn't have a dramatic discontinuity when x1=y1.

But it is possible to make a plot here - whether you trust the results is up to you. First generate a 2D list,

Monitor[twodlist = 
  Table[Quiet@v1[y1, y2, 30], {y2, 0, 5, .2}, {y1, 0, 5, .2}];,{y1,y2}]

Note I wrapped the Table call in Monitor, so that you can see how fast it is going and whether you should go get coffee or just wait a minute. I also used Quiet so as to ignore convergence error messages. Now if you have a worse error, a so-called "Catastrophic" error, where NIntegrate can't give a result, then that message will still come through.

Now you plot the 2D list you made,

{ListPlot3D[Re@twodlist, PlotRange -> All, 
  DataRange -> {{0, 5}, {0, 5}}, InterpolationOrder -> 2, 
  AxesLabel -> {"y2", "y1"}],
 ListContourPlot[Re[twodlist], PlotRange -> All, 
  DataRange -> {{0, 5}, {0, 5}}, InterpolationOrder -> 2, 
  FrameLabel -> {"y2", "y1"}]}

enter image description here

But again, I think you should go back to the integrand and see if there is something you can do to make it easier to integrate.