You were very unclear about what your actual question is. But I'm trying to procrastinate so here's what I would do,
data = Get["http://pastebin.com/raw.php?i=FeEa2MU9"];
lorentzianModel = y0 - a/(b + (x - x0)^2);
I took your CSV file, which you generally can't ask people on this site to download, imported it, and used the command CopyToClipboard[data[[All,;;2]]] and then pasted the result into pastebin.com. That's the easiest way to share example data.
To get the nonlinear fit to work, you need decent guesses for the parameters, which I found by just plotting the model and varying the parameters.
fit = NonlinearModelFit[data,
  lorentzianModel, {{y0, .03}, {a, 5 10^(-7)}, {b, 3 10^-5}, {x0,
    10.25}}, x]

There is really no benefit to multiplying the frequency axis by 10^10 before fitting, you can just do that later. So check the results of the fit,
fit["ParameterConfidenceIntervalTable"]

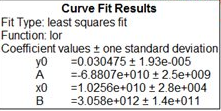
and compare them to what you got from Igor,

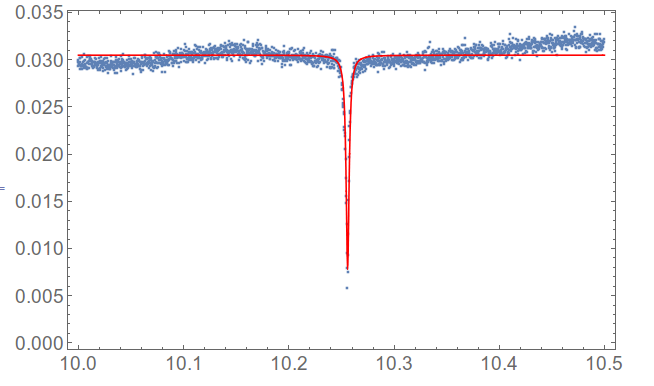
and it looks good. Then plot the results,
Show[ListPlot[data, PlotRange -> All],
 Plot[fit[x], {x, 10.0, 10.5}, PlotStyle -> Red]]

Let me reiterate though, that it is not clear what your question is.


