3
$\begingroup$

I have some data partitioned into three sublists:

data = {{2776.37, 2016.64, 1483.51, 1027.35, 500.878, 94.1385, 
    310.402, 282.548, 257.886, 224.359, 218.688, 209.312, 215.776, 
    198.78}, {40.5063, 24.633, 12.069, 8.3151, 6.35135, 15.0977, 
    8.74372, 15.5125, 9.34959, 9.70696, 11.125, 12.1457, 10.8075, 
    9.7561}, {113.08, 124.633, 75.9698, 59.5186, 55.9459, 7.81528, 
    57.4372, 69.5291, 80.4878, 88.2784, 105.563, 127.935, 148.571, 
    148.78}};

Each sublist can be represented by a label,

samp = {"x", "y", "z"};

I want to create a ListLogPlot with a Tooltip with the sample name that appears when the mouse hovers over each subset. I have tried,

ListLogPlot[Tooltip[data, samp], Joined -> True]
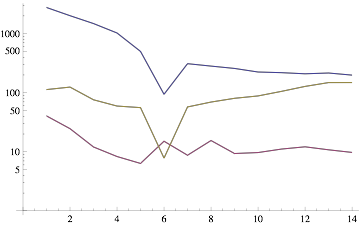
enter image description here

but this flashes "{x,y,z}" for each subset. How do I achieve the desired effect?

$\endgroup$

3 Answers 3

7
$\begingroup$

It seems to me you just need to add Thread:

ListLogPlot[Thread @ Tooltip[data, samp], Joined -> True]
$\endgroup$
6
$\begingroup$
data = {
   {2776.37, 2016.64, 1483.51, 1027.35,
    500.878, 94.1385, 310.402, 282.548,
    257.886, 224.359, 218.688, 209.312,
    215.776, 198.78},
   {40.5063, 24.633, 12.069, 8.3151,
    6.35135, 15.0977, 8.74372, 15.5125,
    9.34959, 9.70696, 11.125, 12.1457,
    10.8075, 9.7561},
   {113.08, 124.633, 75.9698, 59.5186,
    55.9459, 7.81528, 57.4372, 69.5291,
    80.4878, 88.2784, 105.563, 127.935,
    148.571, 148.78}};

samp = {"x", "y", "z"};

ListLogPlot[
 Tooltip @@@ Transpose[{data, samp}],
 Joined -> True]
$\endgroup$
4
$\begingroup$

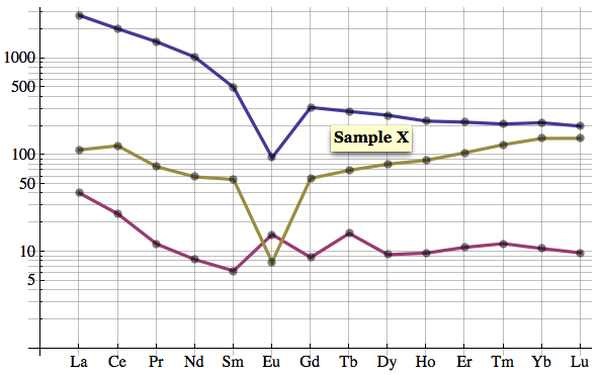
Well I just used your previous question to get this working. You cannot just wrap evrything in ToolTip - you need to wrap each data set in it with its specific label:

ListLogPlot[
  MapThread[
   Tooltip, {data, 
    Style[#, 15, Bold, FontFamily -> "Georgia"] & /@ {"Sample X", 
      "Sample Y", "Sample Z"}}], Joined -> True, 
  Ticks -> {Transpose[{Range[14], xaxis}], Automatic}, 
  PlotStyle -> Thick, GridLines -> {Range[14], Automatic}, 
  GridLinesStyle -> Opacity[.5], Mesh -> All, 
  MeshStyle -> Directive[PointSize[.015], Opacity[.5]]] // Magnify

enter image description here

$\endgroup$
6
  • $\begingroup$ Very nice :) Sorry for the repetitive example but I needed to know both answers and I thought it would be clumsy to put them in one question... $\endgroup$
    – geordie
    Commented Sep 5, 2013 at 4:06
  • $\begingroup$ @geordie I understand. I am not sure what moderators would advise. I personally would still put it in the same question, saying I need 1) x-labels 2) ToolTips - because basically you joining all this in one single object correct? $\endgroup$ Commented Sep 5, 2013 at 4:32
  • $\begingroup$ I guess the issue is that people who are searching for answers to their burning questions might miss one or the other solution if the question title doesn't explicitly describe both. $\endgroup$
    – geordie
    Commented Sep 5, 2013 at 4:58
  • $\begingroup$ @geordie I see your point. BTW did you look through the site for similar questions? I feel like similar things were asked before. $\endgroup$ Commented Sep 5, 2013 at 5:03
  • $\begingroup$ I tried.. this is always one of the issues with searching for existing answers. A lot of questions don't have a very descriptive title and may not be cataloged properly. It can be quite difficult for a casual SE user to know whether or not their particular question is a duplicate. $\endgroup$
    – geordie
    Commented Sep 5, 2013 at 5:35

Your Answer

By clicking “Post Your Answer”, you agree to our terms of service and acknowledge you have read our privacy policy.

Not the answer you're looking for? Browse other questions tagged or ask your own question.