3
$\begingroup$

This link is to a question showing how to display a Fourier transform of an image.

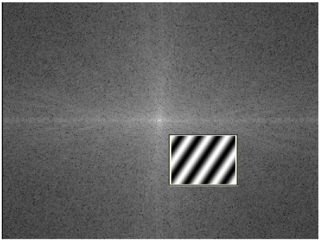
I'd like to build upon the linked solution to make an interactive demonstration, surely using Tooltip, in which the user can select a point in the Fourier magnitude spectrum (Abs), and a graphic of the corresponding cosine wave component is displayed. Specifically, if the Tooltip is above frequency coordinate {sx, sy}, the graphic should be the graphic plot corresponding Abs Re[ Exp[2 Pi Norm[{sx,sy] {x,y}.{sx,sy}]].

If the user points to the center of the Fourier magnitude plot ({sx,sy} = {0,0}), the "DC" value of the photograph is presented throughout the popup window. If the user points to a position at the right, we will see vertical cosine waves in the popup window... the further to the right, the higher the spatial frequency (closer the wavefronts). Likewise, if the user points to positions higher in the plot, we will see horizontal cosine waves... the greater the distance from the center, the higher the frequency of the cosine wave. If the user points to positions along some diagonal, the cosine waves will be tipped.

The amplitude of the displayed sine curve should be the magnitude of the Fourier transform at that sampled point.

A static version of what I seek is on page 31 of this paper.

I ran into immediate difficulties in getting any Tooltip reading from an image.

$\endgroup$
3
  • $\begingroup$ Your link to the paper only has 4 pages, not 31! $\endgroup$
    – march
    Commented Jan 31 at 21:55
  • $\begingroup$ I know! LOOK at "page 31" of the four-page document. $\endgroup$ Commented Feb 1 at 0:03
  • $\begingroup$ Oh I see. Didn't read the fine print. $\endgroup$
    – march
    Commented Feb 1 at 4:21

1 Answer 1

2
+50
$\begingroup$

Here is a crude implementation using Tooltip.

drawWaves[{kx_, ky_}, {sizex_, sizey_}, scaling_] := 
 Image[Table[Re[Exp[2 Pi I {x, -y} . {kx, ky} * scaling]]/2 + 0.5, {y, 0, sizey/scaling}, 
  {x, 0, sizex/scaling}]]

interactiveFT[img_, scaling_ : 5] := 
 DynamicModule[{dims = ImageDimensions[img], imgFT = ImagePeriodogram[img], pos, waves},
  Dynamic[
   pos = MousePosition["GraphicsScaled", {0, 0}] - 0.5;
   waves = drawWaves[pos, dims, scaling];
   Tooltip[imgFT, waves]
   ]
  ]

img = ImageCrop[ExampleData[{"TestImage", "Couple2"}], {400, 300}];
interactiveFT[img]

enter image description here

Note that drawWawes is quite slow for larger images, that is why there is a scaling parameter to generate a smaller image of waves. Instead of a hover, you could also utilize a Locator to only get waves at a mouse click. Please check for yourself that the overall math behind my code is actually correct.

$\endgroup$
4
  • $\begingroup$ Oh nice... excellent ($+1$). Let me wait just a bit to see if anyone gives a marked improvement, but if not I'll accept, as this nearly suffices, save for speed. (I wouldn't have thought that speed is too much of a problem because one merely needs to read a value and quickly plot a sine wave.) $\endgroup$ Commented Feb 6 at 16:57
  • $\begingroup$ Putting definitions of dims and imgFT inside first argument of DynamicModule such as: {pos, waves, dims = ImageDimensions[img], imgFT = ImagePeriodogram[img]} increases the speed. $\endgroup$ Commented Feb 6 at 17:11
  • $\begingroup$ By the way I do not get what the tooltip image should represent since it is totally independent of underlying image? Or maybe the question is more appropriate for OP. $\endgroup$ Commented Feb 6 at 17:46
  • 1
    $\begingroup$ @azerbajdzan, oh, thanks. I was under the impression that these won't get recalculated every time. Yes, the tooltip just shows the corresponding Fourier component at that particular wavelengths. One could multiply it with the magnitude of the FT, then it would depend on the actual image. $\endgroup$
    – Domen
    Commented Feb 6 at 17:55

Your Answer

By clicking “Post Your Answer”, you agree to our terms of service and acknowledge you have read our privacy policy.

Not the answer you're looking for? Browse other questions tagged or ask your own question.