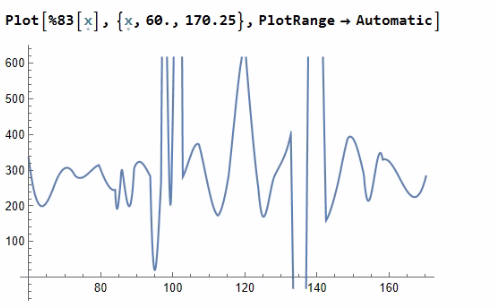
Here is the coarsely digitized data of the first picture (using https://automeris.io/WebPlotDigitizer/
If you want more accurate results, improve on this):
dat=
{{5.48,1.25},{7.23,-2.03},{8.45,-1.83},{8.45,1.57},{8.97,0.113},{9.67,-1.04},{9.97,-1.47},{10.,2.01},{10.3,-0.697},{11.5,0.468},{12.1,-0.257},{12.1,0.783},{12.9,2.38},{21.3,1.16},{23.1,1.4},{24.3,0.0804},{25.8,1.84},{26.8,-1.72},{28.,-1.36},{28.,2.37},{28.,2.72},{28.,3.07},{28.,3.42},{29.6,-0.896},{30.8,-0.359},{32.9,-2.72},{32.9,-2.44},{32.9,-2.09},{33.7,0.688},{37.3,0.0908},{37.7,1.17},{38.2,1.61},{44.5,-1.15},{46.3,-0.776},{47.7,0.442},{49.,-0.391},{51.8,0.0232},{59.,-0.533},{59.7,0.903},{59.7,1.25},{61.3,1.7},{63.4,-0.87},{63.4,0.143},{63.4,0.603},{66.4,-1.38},{73.1,-2.34},{73.1,-2.},{74.,1.07},{74.,1.42},{74.6,-1.6},{75.6,1.85},{76.6,0.0798},{78.,2.32},{81.7,-1.06},{82.1,-2.64},{82.4,0.722},{82.9,-2.17},{82.9,-1.82},{85.4,-0.708},{87.8,-0.285},{87.8,1.2},{88.8,-1.4},{92.1,0.0181},{97.6,0.446},{99.,0.922},{101.,-1.03},{103.,-0.583},{106.,0.075},{106.,1.42},{106.,1.77},{106.,2.16},{106.,2.5},{106.,2.85},{107.,-1.69},{109.,-2.13},{115.,0.671},{115.,1.13},{115.,0.369},{116.,-1.41},{117.,-2.27},{120.,-1.04},{121.,-0.378},{121.,-0.735},{122.,0.0312},{124.,1.61},{125.,-1.88},{132.,-2.11},{132.,-1.41},{132.,0.413},{132.,0.76},{133.,-1.75},{133.,1.22},{133.,-0.611},{134.,-0.0938},{138.,-0.99},{144.,1.82},{150.,-1.03},{150.,0.048},{151.,-0.741},{151.,-0.411},{151.,0.683},{151.,1.03},{152.,0.351},{153.,1.44},{165.,-1.19},{166.,0.0782},{168.,0.469},{168.,0.821},{168.,1.17},{169.,-0.795},{170.,2.05},{170.,1.64},{176.,-0.242},{184.,-1.13},{184.,-0.834},{188.,0.0473},{188.,0.294},{188.,1.35},{188.,1.7},{188.,2.05},{189.,-2.64},{189.,-2.34},{189.,-1.99},{189.,0.617},{189.,0.998},{190.,2.46},{194.,-1.58},{196.,2.96},{198.,2.58},{200.,-1.26},{202.,-0.102},{202.,0.603},{202.,1.56},{202.,1.92},{202.,-0.821},{203.,-1.73},{204.,1.12},{213.,0.145},{216.,-0.487},{222.,-0.114},{223.,2.35},{223.,2.7},{225.,-1.49},{226.,-0.988},{226.,-0.485},{228.,0.0997},{228.,0.459},{228.,0.809},{228.,1.16},{228.,1.51},{228.,1.86},{234.,-1.8},{241.,0.571},{242.,0.165},{243.,0.92},{244.,-1.42},{244.,-1.07},{244.,-0.714},{244.,-0.218},{244.,1.38},{245.,-2.22},{246.,3.55},{246.,4.4},{247.,4.07},{248.,3.11},{248.,-1.75},{249.,2.08},{250.,2.57},{250.,1.78},{257.,0.122},{261.,-1.32},{261.,0.533},{261.,0.884},{262.,-0.903},{262.,1.38},{263.,-2.23},{266.,1.9},{266.,2.25},{267.,2.74},{271.,0.709},{271.,1.18},{271.,1.53},{271.,-1.69},{272.,-0.282},{273.,0.0812},{273.,-1.28},{275.,-0.932},{279.,0.427},{283.,-0.495},{288.,0.0485},{292.,0.402},{294.,0.769},{298.,-2.05},{299.,-1.68},{299.,-1.33},{299.,-0.974},{300.,-0.487},{304.,0.0895},{304.,-2.56},{305.,1.21},{307.,0.424},{308.,-1.75},{311.,1.74},{314.,-1.18},{317.,-0.734},{319.,0.794},{319.,0.0816},{323.,-0.382},{329.,1.12},{331.,0.601},{333.,-0.866},{334.,0.0928},{334.,-1.77},{337.,-1.45},{337.,-0.366},{338.,1.74},{339.,-3.1},{339.,-2.73},{340.,-2.25},{340.,1.38},{341.,-3.52},{343.,2.56},{343.,2.91},{343.,3.26},{343.,3.61},{343.,3.97},{345.,0.679},{345.,-0.799},{347.,2.12},{348.,0.0899},{350.,-0.33},{353.,1.12},{354.,1.59},{359.,-1.03},{361.,-1.43},{362.,0.521},{363.,-0.685},{364.,-0.4},{365.,0.00345},{371.,0.929},{371.,1.28},{371.,1.63},{371.,1.98},{371.,2.34},{373.,2.77},{375.,-2.4},{376.,-2.04},{376.,-1.34},{377.,-1.69},{377.,0.641},{377.,-0.819},{379.,0.0482},{380.,3.35},{381.,-0.34},{381.,2.65},{381.,3.},{384.,-2.93},{384.,1.54},{384.,1.89},{384.,2.24},{386.,-2.45},{388.,1.13},{392.,0.264},{393.,-1.8},{393.,-1.47},{393.,-1.12},{393.,0.672},{394.,-2.19},{394.,-0.72},{399.,0.00283},{403.,-0.339},{406.,1.05},{406.,1.4},{408.,1.77},{409.,2.18},{410.,0.694},{411.,-2.5},{411.,-2.12},{411.,-1.79},{411.,-1.44},{411.,-1.09},{412.,-0.69},{415.,0.0176},{420.,-2.14},{420.,-1.69},{420.,-1.33},{421.,1.54},{421.,1.89},{421.,2.24},{421.,2.59},{421.,2.94},{423.,0.366},{424.,-0.308},{425.,0.834},{425.,1.19},{426.,-0.842},{431.,0.161},{439.,0.63},{439.,-0.264},{440.,0.976},{440.,1.38},{441.,1.77},{441.,-1.46},{443.,-1.04},{443.,2.4},{444.,0.122},{444.,-0.6},{452.,-1.88},{453.,1.6},{457.,-0.59},{458.,0.529},{458.,0.895},{458.,1.25},{458.,0.2},{459.,-0.131},{461.,-1.92},{464.,-1.48},{466.,-1.02},{471.,-0.169},{471.,0.505},{471.,0.856},{473.,0.122},{473.,1.25},{476.,-0.473},{485.,-2.14},{485.,-1.8},{485.,1.56},{485.,2.03},{487.,0.564},{487.,0.198},{488.,1.03},{488.,-0.0119},{489.,-1.17},{489.,2.95},{489.,3.3},{490.,-0.791},{491.,-1.54},{493.,2.5},{499.,-0.256},{501.,0.266},{502.,-0.714},{502.,1.45},{502.,1.87},{503.,2.36},{503.,-1.5},{504.,-1.06},{505.,-1.71},{506.,1.03},{508.,0.702},{516.,0.203},{518.,-0.702},{520.,-1.04},{520.,0.786},{521.,-1.48},{522.,-0.173},{531.,0.415},{536.,-0.698},{536.,-0.0549},{538.,0.943},{540.,-0.463},{541.,1.45},{550.,0.529},{551.,-0.00119},{557.,-0.939},{557.,-0.536},{560.,-1.28},{561.,0.224},{562.,1.08},{562.,0.607},{568.,-0.0193},{573.,-0.452},{580.,-0.63},{580.,0.33},{581.,0.745},{582.,1.23},{585.,0.144},{586.,-1.21},{586.,1.78},{586.,2.13},{591.,-0.885},{594.,-0.416},{596.,-1.73},{596.,0.654},{596.,1.},{598.,1.48},{599.,-2.43},{599.,-2.09},{599.,3.07},{599.,3.42},{599.,0.0778},{601.,-1.38},{602.,-2.88},{602.,2.64},{604.,1.96},{604.,2.31},{606.,-0.491},{609.,-1.03},{609.,1.47},{611.,0.937},{612.,-1.79},{614.,-1.38},{614.,0.133},{616.,0.625},{621.,-0.38},{621.,-0.767},{629.,-2.28},{630.,1.04},{631.,0.0983},{632.,-2.07},{632.,-1.71},{633.,0.592},{633.,-1.25},{637.,-0.756},{639.,-0.279},{641.,1.67},{646.,0.273},{648.,-2.39},{649.,-2.01},{649.,-1.66},{649.,1.55},{650.,-1.18},{651.,2.16},{651.,0.773},{652.,-2.72},{652.,2.49},{652.,2.82},{653.,1.25},{653.,1.78},{653.,3.23},{654.,-0.721},{655.,-0.189},{657.,3.72},{661.,0.115},{666.,0.818},{666.,0.31},{668.,-1.65},{668.,-0.676},{668.,2.29},{668.,-1.2},{671.,-0.383},{671.,1.51},{671.,1.86},{672.,-2.21},{674.,1.16},{676.,-1.7},{677.,0.0666},{681.,0.684},{684.,-0.476},{687.,0.995},{687.,1.35},{688.,-1.15},{691.,0.0786},{697.,0.556},{700.,1.01},{701.,-0.753},{702.,-0.376},{705.,-1.09},{706.,0.111},{707.,1.44},{718.,-0.986},{718.,0.484},{718.,0.976},{719.,-0.533},{721.,1.5},{721.,1.85},{721.,2.2},{721.,2.55},{721.,2.9},{722.,0.0995},{723.,3.35},{726.,-1.42},{726.,-3.62},{726.,-3.27},{726.,-2.91},{726.,-2.56},{726.,-2.17},{726.,-1.84},{726.,4.95},{726.,5.3},{726.,5.66},{726.,6.01},{726.,6.36},{726.,6.71},{726.,7.06},{726.,7.41},{726.,7.77},{726.,8.12},{726.,8.47},{726.,8.82},{726.,9.17},{726.,9.52},{726.,9.88},{726.,10.2},{726.,10.6},{726.,10.9},{726.,11.3},{726.,11.6},{726.,12.},{726.,12.3},{726.,12.7},{726.,13.},{726.,13.4},{726.,13.7},{727.,-3.99},{727.,0.734},{730.,3.8},{730.,4.15},{730.,4.5},{731.,0.0109},{735.,1.06},{740.,3.61},{740.,4.31},{743.,-2.59},{743.,-4.39},{743.,-4.04},{743.,-3.69},{743.,-3.34},{743.,1.79},{743.,2.14},{743.,2.49},{743.,2.84},{744.,1.4},{745.,-3.},{745.,3.29},{745.,3.88},{746.,0.145},{748.,-1.89},{748.,-1.54},{748.,-1.1},{749.,0.862},{749.,-0.701},{749.,-0.349},{750.,-2.21},{751.,0.574},{760.,1.29},{761.,1.71},{761.,0.0773},{763.,0.892},{764.,0.566},{765.,-1.59},{765.,-1.26},{768.,-0.854},{770.,-0.429},{773.,0.326},{775.,0.97},{775.,1.32},{775.,1.67},{775.,2.03},{775.,2.38},{779.,-0.121},{781.,-0.729},{789.,-0.953},{792.,0.17},{794.,-1.98},{795.,0.898},{795.,1.37},{796.,0.581},{797.,-1.47},{799.,1.91},{800.,-0.502},{801.,-0.952},{807.,0.109},{813.,-0.742},{813.,0.914},{814.,0.66},{814.,1.38},{814.,-0.419},{819.,-2.8},{821.,0.102},{821.,-2.09},{821.,-1.74},{821.,-1.39},{821.,2.03},{821.,2.38},{821.,2.73},{821.,3.08},{821.,3.43},{822.,-2.48},{823.,-0.961},{828.,0.844},{830.,1.24},{831.,-0.292},{831.,1.62},{832.,-0.745},{836.,0.0996},{837.,0.534},{842.,-1.86},{842.,-0.696},{843.,-1.05},{843.,1.84},{844.,-1.52},{845.,2.26},{845.,2.62},{847.,-0.295},{849.,1.19},{851.,0.15},{851.,1.59},{855.,0.74},{857.,-2.07},{857.,-2.57},{858.,-3.24},{858.,-1.87},{858.,2.84},{858.,3.17},{860.,-0.329},{860.,2.07},{860.,2.42},{861.,-1.46},{863.,-1.08},{864.,-0.658},{864.,0.14},{867.,1.2},{869.,1.66},{871.,0.577},{873.,2.18},{876.,-1.28},{877.,-0.183},{878.,-0.758},{880.,0.83},{880.,1.18},{880.,1.53},{884.,-1.02},{885.,0.437},{886.,0.119},{897.,-0.172},{899.,-0.615},{903.,0.571},{903.,0.133},{909.,-0.954},{909.,1.39},{909.,-1.88},{910.,1.78},{911.,0.939},{912.,-1.46},{913.,-0.454},{915.,2.12},{916.,0.4},{917.,-0.00841},{917.,-0.966},{920.,1.62},{924.,1.07},{932.,-0.0653},{932.,-0.574},{936.,0.556},{939.,1.8},{939.,2.15},{940.,-1.5},{941.,-0.975},{942.,1.01},{942.,1.36},{943.,-1.95},{946.,-0.471},{946.,0.0401},{952.,0.575},{959.,-2.14},{961.,-0.323},{961.,0.163},{961.,-1.7},{961.,1.16},{962.,-1.04},{962.,-1.45},{963.,2.83},{963.,3.18},{964.,-0.727},{968.,0.732},{968.,1.79},{968.,2.14},{968.,2.49},{969.,1.45},{976.,0.0741},{978.,0.37},{978.,1.07},{980.,-1.63},{981.,-1.23},{981.,-0.874},{983.,-0.498},{985.,2.54},{986.,0.572},{989.,2.08},{990.,0.059},{990.,1.4},{990.,1.71},{991.,0.884},{992.,0.147},{995.,-2.17},{997.,-1.62},{997.,-1.26},{998.,-2.59},{998.,-0.541},{999.,-0.928},{1000.,3.03},{1000.,3.39},{1000.,3.74},{1000.,4.09},{1010.,0.0913},{1010.,0.475},{1010.,0.827},{1010.,1.18},{1010.,1.53},{1010.,1.88},{1010.,2.23},{1010.,2.58},{1010.,-2.14},{1010.,-1.12},{1010.,-0.496},{1010.,-1.65},{1020.,0.573},{1020.,0.127},{1030.,0.75},{1030.,1.1},{1030.,1.45},{1030.,1.8},{1030.,2.25},{1030.,-2.09},{1030.,-1.05},{1030.,-0.696},{1030.,-0.344},{1030.,-1.43},{1030.,-1.73},{1030.,2.71},{1030.,2.33},{1040.,0.219},{1040.,1.56},{1040.,1.9},{1040.,0.651},{1040.,1.16},{1040.,-1.09},{1040.,-0.715},{1050.,-0.509},{1050.,-0.0293},{1050.,0.282},{1050.,0.663},{1060.,-0.667},{1070.,-0.085},{1070.,0.547},{1070.,0.898},{1070.,0.232},{1070.,1.34},{1070.,2.57},{1070.,2.92},{1070.,3.37},{1070.,-0.933},{1080.,-1.47},{1080.,1.87},{1080.,2.22},{1080.,-0.339},{1080.,-1.74},{1090.,0.0641},{1090.,0.247},{1090.,0.636},{1090.,0.987},{1090.,1.47},{1090.,-0.873},{1090.,-1.34},{1100.,-1.75},{1100.,2.07},{1100.,-0.975},{1100.,-1.27},{1100.,0.244},{1100.,2.63},{1100.,2.98},{1100.,3.33},{1100.,-0.554},{1100.,1.93},{1100.,2.28},{1110.,0.852},{1110.,1.2},{1110.,1.55},{1110.,-0.0916},{1120.,1.37},{1120.,-0.68},{1120.,-0.994},{1120.,0.468},{1120.,0.982},{1120.,-0.432},{1120.,-0.0364},{1140.,0.404},{1140.,-1.05},{1140.,-0.0314},{1140.,-0.746},{1140.,-0.417},{1140.,1.04},{1140.,1.51},{1140.,0.756},{1140.,-1.5},{1150.,0.432},{1150.,1.6},{1150.,-1.},{1150.,1.11},{1150.,-0.101},{1150.,0.786},{1160.,-0.61},{1160.,-1.56},{1170.,-0.218},{1170.,0.21},{1170.,1.23},{1170.,1.58},{1170.,1.93},{1170.,0.816},{1170.,-1.87},{1170.,2.41},{1170.,-0.88},{1170.,2.96},{1170.,3.31},{1170.,-1.45},{1180.,-0.424},{1180.,0.435},{1180.,0.0839},{1190.,-2.04},{1190.,-1.7},{1190.,-2.48},{1190.,1.2},{1190.,-0.648},{1190.,0.809},{1190.,1.68},{1190.,2.03},{1190.,2.46},{1190.,-1.45},{1190.,2.75},{1190.,-1.04},{1190.,-0.343},{1200.,0.168},{1200.,0.602},{1200.,1.05},{1200.,1.4}}

    ListLinePlot[dat,PlotRange->All]

And the power spectrum (squared magnitude of Fourier coefficients):
Periodogram[dat[[All, 2]], ScalingFunctions -> "dB", PlotRange -> All]


Fourier? Which is FFT in Mathematica. $\endgroup$