4
$\begingroup$

So I'm trying to plot lines on which the following function is a constant $$ \frac{\left(-\Sigma (r,0.99,\theta )+2 r^2-0.99^2 r \sin ^2(\theta )\right)^2}{\Delta (r,1,0.99) \Sigma (r,0.99,\theta )^3}+\frac{0.99^4 \sin ^2(\theta ) \cos ^2(\theta ) \Delta (r,1,0.99)}{\Sigma (r,0.99,\theta )^4} $$ where $$\Delta (r,M,a):=a^2-2 M r+r^2\quad\text{and}\quad\Sigma (r,a,\theta):=a^2 \cos ^2(\theta )+r^2. $$ I'm using the following code which was motivated from the second comment on this post

Σ[r_, a_, θ_] := r^2 + a^2*Cos[θ]^2;
Δ[r_, M_, a_] := r^2 - 2 M r + a^2;
cValues = 
   {0.01, 0.1, 0.08, 0.06, 0.003, 0.005, 0.12, 0.14, 0.2, 0.15, 0.02, 0.04, 
    0.03, 0.18, 0.22, 1.5, 2.3, 0.002, 0.0025, 0.003, 0.0015, 0.0018, 0.0023, 
    0.0011, 0.0009, 0.0008, 0.0007, 0.0006, 0.0005};
trajectories = 
  Function[{x, y, r, θ},  
    Σ[r, 0.99, θ]^(-3)*Δ[r, 1, 0.99]^(-1)*(2 r^2 - 
    Σ[r, 0.99, θ] - 0.99^2 r Sin[θ]^2)^2 + 
    Δ[r, 1, 0.99]*0.99^4*Σ[r, 0.99, θ]^(-4) Sin[θ]^2 Cos[θ]^2];
ParametricPlot[{Sqrt[r^2 + 0.99^2]*Sin[θ], r Cos[θ]}, {r, 0, 5}, {θ, 0, Pi/2}, 
  PlotStyle -> {Green}, MeshFunctions -> {trajectories}, Mesh -> {cValues}]

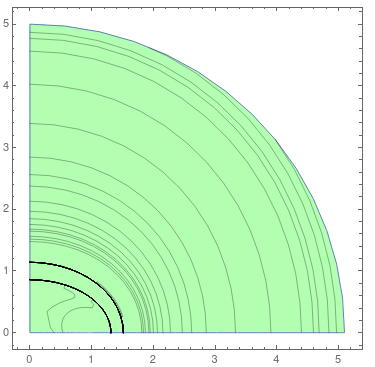
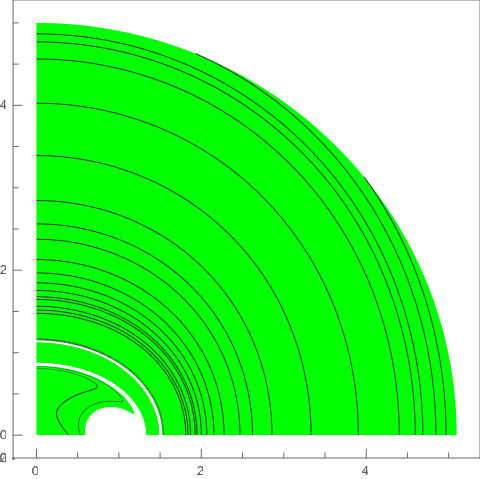
and it gives the output as shown here (the second one is the zoomed out version of the first).

enter image description hereenter image description here

As you can see, the bottom left corner has strange behavior and I'm not sure why. I also do not understand what the trajectories part of this code is doing, more precisely why does the Function have 4 arguments in the beginning? Please help.

(context: I'm trying to plot the lines of constant acceleration in Kerr spacetime)

$\endgroup$
4
  • $\begingroup$ increasing the PlotPoints -> 100 $\endgroup$
    – cvgmt
    Commented Oct 17, 2020 at 11:39
  • $\begingroup$ These "strange" trajectories are no artefact. They are real, created by cValues = {1.5, 2.3}; It would be interesting to know what it means in physics. $\endgroup$ Commented Oct 17, 2020 at 14:21
  • $\begingroup$ The "anomalies" would be smoother if you add the options PlotPoints -> 100, MaxRecursion -> 5 to the ParametricPlot. This would of course slow down the computation for the plot. $\endgroup$
    – Bob Hanlon
    Commented Oct 17, 2020 at 15:57
  • $\begingroup$ Thanks! the PlotPoints did the trick, it is exactly what I wanted. $\endgroup$
    – user51833
    Commented Oct 19, 2020 at 5:04

3 Answers 3

4
$\begingroup$

The MeshFunctions is a powerful method which I always use.

Here we view the Mesh from 3D. So we draw the ParametricPlot3D $$\begin{cases}x=\sqrt{r^2+0.9801} \sin (\theta ),\\ y=r \cos (\theta ),\\ z=f(r,\theta)\end{cases}$$

We set the ViewPoint={0,0,Infinity} and use ViewProjection -> "Orthographic"

Clear["`*"];
Σ[r_, a_, θ_] = r^2 + a^2*Cos[θ]^2;
Δ[r_, M_, a_] = r^2 - 2 M r + a^2;
f[r_, θ_] = Σ[r, 
      0.99, θ]^(-3)*Δ[r, 1, 
      0.99]^(-1)*(2 r^2 - Σ[r, 0.99, θ] - 
       0.99^2 r Sin[θ]^2)^2 + Δ[r, 1, 
     0.99]*0.99^4*Σ[r, 
      0.99, θ]^(-4) Sin[θ]^2 Cos[θ]^2;
cValues = {0.01, 0.1, 0.08, 0.06, 0.003, 0.005, 0.12, 0.14, 0.2, 0.15,
    0.02, 0.04, 0.03, 0.18, 0.22, 1.5, 2.3, 0.002, 0.0025, 0.003, 
   0.0015, 0.0018, 0.0023, 0.0011, 0.0009, 0.0008, 0.0007, 0.0006, 
   0.0005};
ParametricPlot3D[{Sqrt[r^2 + 0.99^2]*Sin[θ], r Cos[θ], 
  f[r, θ]}, {r, 0, 5}, {θ, 0, π/2}, 
 PlotPoints -> 150, MeshFunctions -> (#3 &), Mesh -> {cValues}, 
 PlotStyle -> Green, ViewProjection -> "Orthographic", 
 ViewPoint -> {0, 0, ∞}, Lighting -> {White, "Neutral"}]

enter image description here

$\endgroup$
4
$\begingroup$

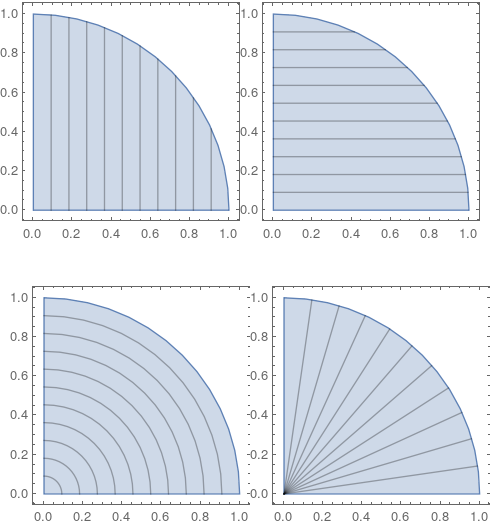
Regarding your question as to why trajectories has four arguments: MeshFunctions for ParametricPlot need three to four arguments. The first two correspond to the coordinates of the plot, the last two (or one) to the parameters of the ParametricPlot.

To appreciate this better, consider the following example:

funs = {
   Function[{x, y, u, v}, x],
   Function[{x, y, u, v}, y],
   Function[{x, y, u, v}, u],
   Function[{x, y, u, v}, v]
   };
Row@Table[ParametricPlot[
   {r Cos[\[Theta]], r Sin[\[Theta]]},
   {r, 0, 1}, {\[Theta], 0, \[Pi]/2},
   MeshFunctions -> fun,
   Mesh -> 10,
   ImageSize -> Small
   ], {fun, funs}
  ]

Illustration of the usage of MeshFunctions.

$\endgroup$
2
  • $\begingroup$ Since the original code is {Sqrt[r^2 + 0.99^2]*Sin[\[Theta]], r Cos[\[Theta]]} instead of r*Sin[\[Theta]],r Cos[\[Theta]]} , so it is not a polar coordinate. $\endgroup$
    – cvgmt
    Commented Oct 17, 2020 at 11:31
  • $\begingroup$ OK, I guess actually the ParametricPlot hack is the way to go! $\endgroup$
    – Natas
    Commented Oct 17, 2020 at 12:19
1
$\begingroup$

@Natas, the thing is with this question that equipotentials are not plotted in polar coordinates, they are plotted in some special coordinates similar to polar coordinates (take a look at the first argument in ParametricPlot, "ParametricPlot[{Sqrt[r^2 + 0.99^2]*Sin[[Theta]], r Cos[[Theta]]},..."). That is why ParametricPlot way was used instead of ContourPlot, it allows you to use user defined coordinates that are not built-in in Mathematica. With polar coordinates you can perform transformation to cartesian coordinates "Polar" -> "Cartesian", because they're built-in in Mathematica, but not with user defined coordinates, which is the case in this question. I'm not sure, if ContourPlot supports user defined coordinates

$\endgroup$
1
  • 2
    $\begingroup$ Thanks for pointing this out. The coordinate system chosen here are the so-called Boyer-Lindquist coordinates used typically for rotating black holes. $\endgroup$
    – Natas
    Commented Oct 17, 2020 at 12:27

Your Answer

By clicking “Post Your Answer”, you agree to our terms of service and acknowledge you have read our privacy policy.