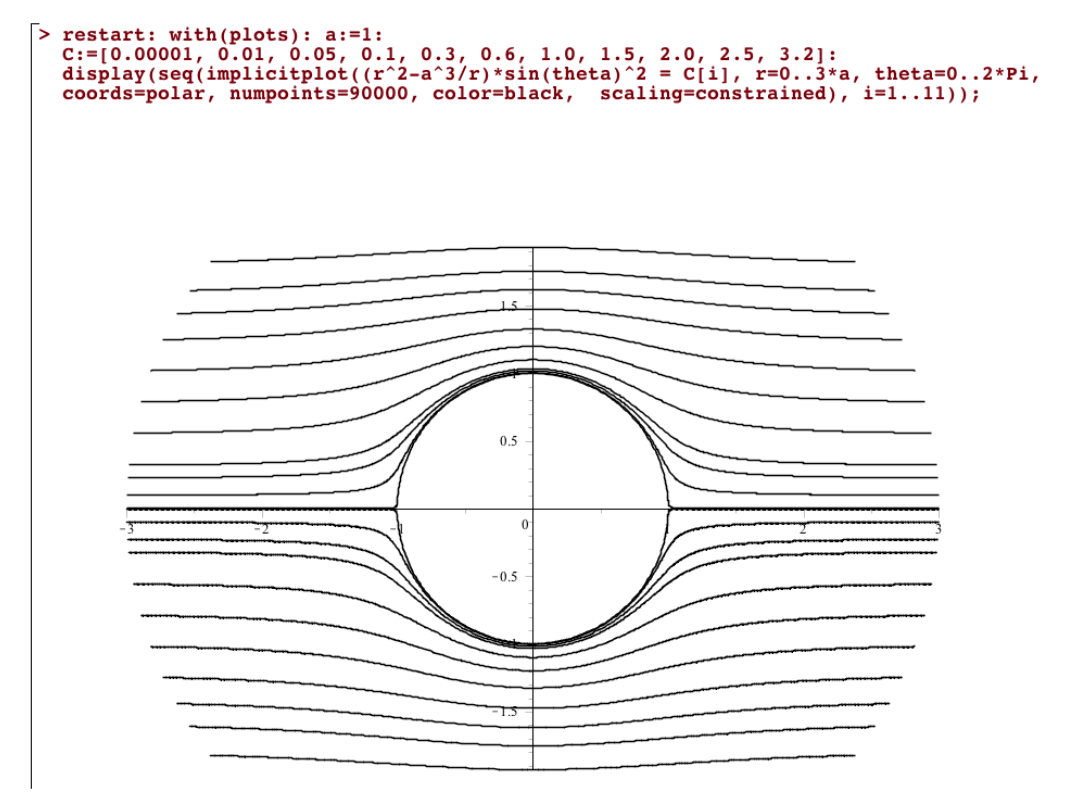
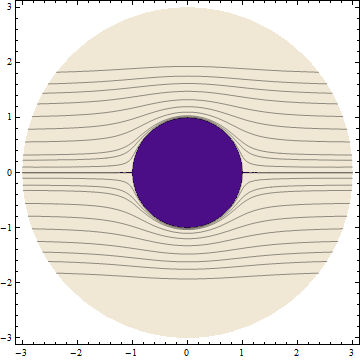
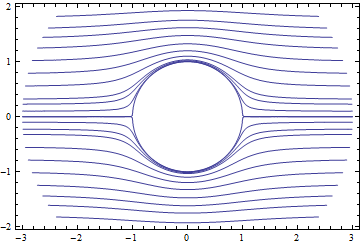
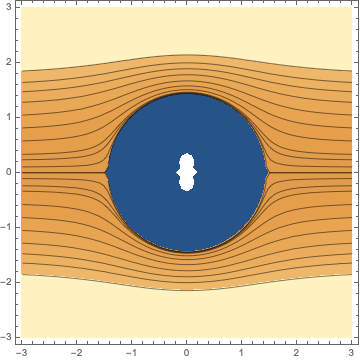
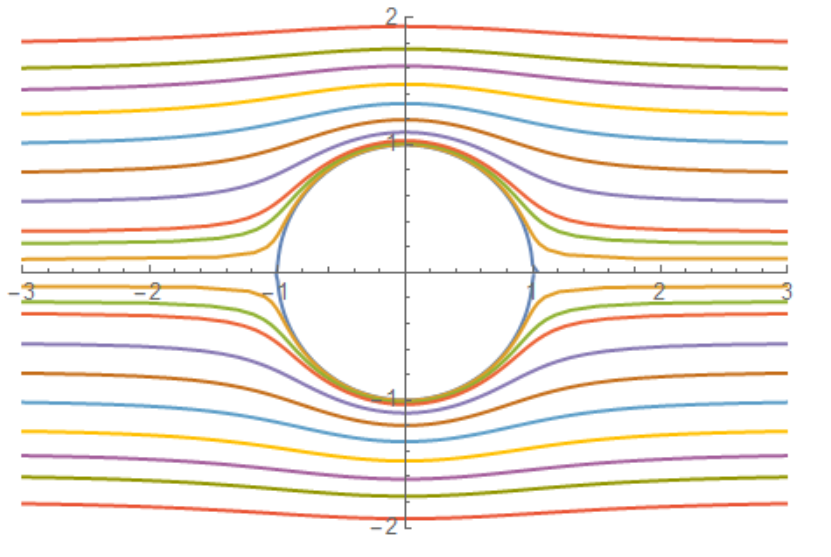
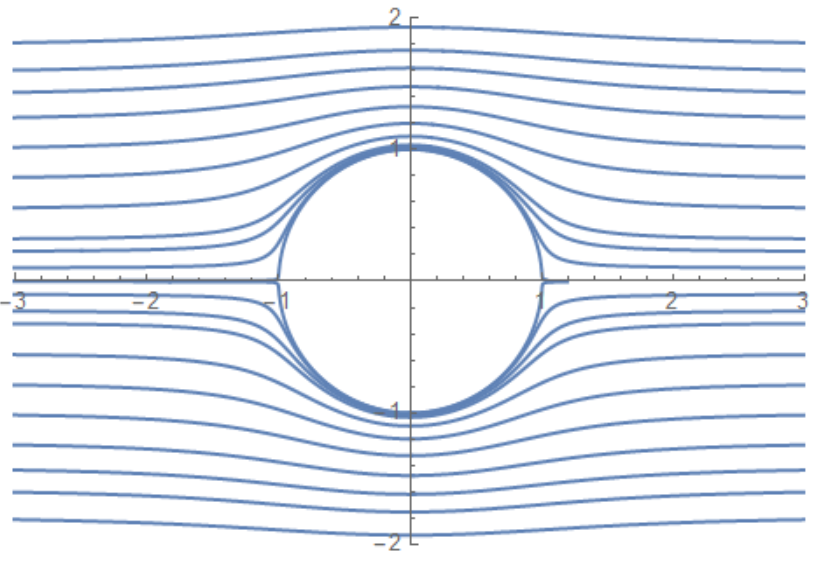
I am following a text on fluid mechanics with MAPLE examples.
I want to do the following ContourPlot in Mathematica in Polar coordinates:
$$ (r^2-\frac{a^3}{r}) \sin^{2}\theta$$
where $a=1$
cValues = {0.00001, 0.01, 0.05, 0.1, 0.3, 0.6, 1.0, 1.5, 2.0, 2.5, 3.2}
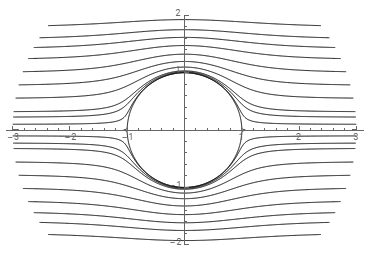
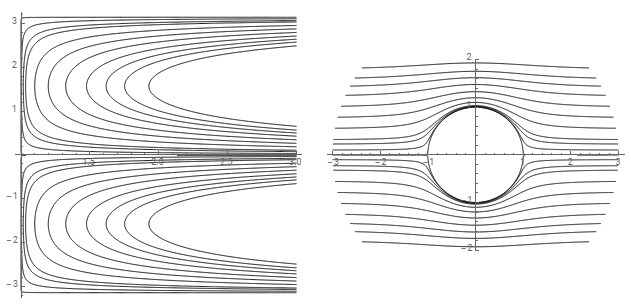
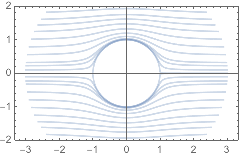
This is a ContourPlot in Polar coordinates.
$$ (r^2-\frac{a^3}{r}) \sin^{2}\theta=C $$
$C$ is a constant. Notice that MAPLE requires the user to specify the values of $C$.
What is a simple, convenient way to implement polar contour plots?
Note. The picture above represents a sphere at rest in an infinite stream of an ideal fluid. The system is axially symmetric, hence we can use Polar coordinates (instead of Spherical coordinates).

