One view of the problem focuses on the issue of getting a sample point in the one valley where the absolute minimum lies. If you know something about the minimum width of the valleys of your objective function(s), then one can sample at regular intervals of less than this width. To write a generic solver, the minimum width would be unknown. In this answer, I will present an approach that should work on a fairly smooth objective function.
The method is based on making a Chebyshev approximation to the function. When the approximation is fairly good, there will usually be several sample points per oscillation, assuming the amplitude of the oscillations are fairly large. The function values at the sample points are computed Chebyshev approximation. These can be used to locate valleys using PeakDetect[-values]. Finally FindMinimum is used to polish the minima, and the ones with the least function value are returned. (It's set up to return multiple solutions, if the absolute minimum occurs at several locations. It's possible that some locations are missed in some cases.)
Example uses
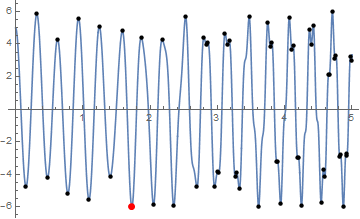
OP's example:
min1 = chebMinimize[Sin[10 x^2] + 5 Cos[20 x], {x, 0, 5}]  // AbsoluteTiming
(*  {0.020218,  {-5.99997, {{x -> 1.72776}}} }  *)
Minima at end points:
chebMinimize[-x^2, {x, -1, 1}]
(*  {-1., {{x -> 1.}, {x -> -1.}}}  *)
Example with almost 10000 local minima:
obj = Sin[50000 x + 1]/1000 + Sin[200 Cos[Pi x/2]^8 x];
min1 = chebMinimize[obj, {x, -1, 1}, MaxRecursion -> 20]  // AbsoluteTiming
(*  {4.79622,  {-1.001, {{x -> -0.605373}}} }  *)
The underlying Chebyshev approximation is much faster than 10000 FindMinima[] calls. One can limit the number of local minima and speed things up:
min1 = chebMinimize[obj, {x, -1, 1}, MaxRecursion -> 20, "MaxMinima" -> 100]  //
  AbsoluteTiming
(*  {0.08998,  {-1.001, {{x -> -0.605373}}} }  *)
The least local minima (in the discrete list of values of obj at the sample points) are chosen, but it's possible to undersample. The success depends on where the sample points fall with respect to the absolute minimum. Note that the result below, while close, is not quite right.
min2 = chebMinimize[obj, {x, -1, 1}, MaxRecursion -> 20, "MaxMinima" -> 10]  //
  AbsoluteTiming
(*  {0.046868,  {-1.001, {{x -> -0.340726}}} }  *)

min1[[2, 1]] - min2[[2, 1]]
(*  -1.07694*10^-7  *)
Code dump
There are two helper functions. The function cheb`approx[] computes a Chebyshev series approximation to a function f over an interval {x, a, b}; it returns the sample points/abscissae and function values in the form {xvals, fvals}. The function cheb`minpos[] returns the positions of the local minima in a list of values.
There is an irrelevant data structure cheb`data that I've been using to inspect the workings of the algorithm. For example, Length@cheb`data["Y"] will give the number of function values, and Length@cheb`data["M"] gives the number of local minima. (It gets overwritten with every call to chebMinimize[].)
ClearAll[chebMinimize];
Options[chebMinimize] = {MinRecursion -> 4, MaxRecursion -> 10,
   Tolerance -> 1.*^-8,
   "SuppressMessages" :> {FindMinimum::lstol, FindMinimum::reged},
   "MaxMinima" -> Infinity};
chebMinimize::ncv =
  "chebMinimize failed to converge to prescribed accuracy after `1` \
recursive bisections of {`2`, `3`}. chebMinimize obtained `4` for the \
relative error estimate.";

Clear[cheb`minpos, cheb`approx];
(* Returns the indices of the search starting point of the bracketing sample points.
* Note that the Chebyshev abscissae are reversed *)
cheb`minpos[v_] := Flatten[SparseArray[PeakDetect[-v, 0, 0, Infinity]]["NonzeroPositions"]];

(* Returns the abscissae and function values of a
* Chebyshev approximation of f of absolute error less than tolerance *)
cheb`$keys = {
   "X", (* x-values/abscissae *)
   "Y", (* y-values/function values *)
   "F", (* the function f *)
   "I", (* the interval {x, a, b} *)
   "E", (* error *)
   "C", (* Chebyshev coefficients *)
   "M", (* positions of the local minima *)
   "FM" (* FindMinimum results *)
   };
cheb`data = AssociationMap[None &, cheb`$keys];  (* not needed; used for diagnostics *)
cheb`approx[f_, {x_, a_, b_}, tolerance_, minR_: 4, maxR_: 10] :=
  Module[{vf, xvals, fvals, error, r = minR,
    coeffs},  (* coeffs are not needed; saved in cheb`data *)
   If[Quiet@ListQ[f /. x -> {N@a}],    (* vf = Listable-ized f *)
    vf = Evaluate[f /. x -> #] &,
    vf = Map[Evaluate[f /. x -> #] &, #] &;
    ];
   {xvals, fvals} = NestWhile[
     Function[{xx, ff},
        (* recursive bisection of abscissae *)
        With[{new = Rescale[Cos[Pi Range[1., 2^r, 2]/2^r], {-1, 1}, {a, b}]},
         r++;
         {Riffle[xx, new], Riffle[ff, vf[new]]}   (* riffle new values *)
         ]
        ] @@ # &,
     (r++; {#, vf[#]}) &@     (* initial subdivision of {a,b} *)
      Rescale[Cos[Pi Range[0., 2^r]/2^r], {-1, 1}, {a, b}],
     (error =                 (* calculate error from tail of Chebyshev series *)
        Total@Abs@#[[-Max[2, r] ;;]]/Max@Abs[#] &[
          coeffs = FourierDCT[Last@#, 1]]) > tolerance &,
     1,
     1 + maxR - minR
     ];
   If[error > tolerance,      (* check error *)
    Message[chebMinimize::ncv, maxR, a, b, error]
    ];
   cheb`data =
    AssociationThread[cheb`$keys -> {xvals, fvals, f, {x, a, b}, error, coeffs, {}, {}}];
   {xvals, fvals}
   ];

chebMinimize[f_, {x_, a_, b_}, opts : OptionsPattern[]] :=
  Module[{xvals, fvals, minima, res},
   (* get sample points & values *)
   {xvals, fvals} =
    cheb`approx[f, {x, a, b},
     OptionValue[Tolerance],
     OptionValue[MinRecursion],
     OptionValue[MaxRecursion]];

   (* get positions of minima in fvals *)
   minima = cheb`minpos[fvals];
   If[NumericQ[OptionValue["MaxMinima"]] &&
       Length@minima > OptionValue["MaxMinima"],
    minima = minima[[
       Ordering[fvals[[minima]], OptionValue["MaxMinima"]]
       ]]
    ];
   cheb`data["M"] = minima;

   (* polish minima with FindMinimum *)
   res = With[{msgs = OptionValue[chebMinimize, {opts}, "SuppressMessages", Hold] /.
       {All | Automatic :> Sequence[], None -> {}}},
     msgs /. Hold[m___] :> MinimalBy[First]@
        Quiet[
         cheb`data["FM"] = FindMinimum[f,
             {x,
              xvals[[#]],
              xvals[[Clip[# + 1, {1, Length@xvals}]]],
              xvals[[Clip[# - 1, {1, Length@xvals}]]]}
             ] & /@ minima,
         m]];
   MapAt[First, Transpose@res, 1]
   ];
Some analysis of the algorithm
The accuracy of a Chebyshev series approximation can be estimated from the tail of the series:
$$\left|f(x) - \sum_{k=0}^N c_k T_k(x)\right| =
\left|\sum_{k=N+1}^\infty c_k T_k(x)\right| \le
\sum_{k=N+1}^\infty \left|c_k \right|$$
since $|T_k(x)| = |\cos(k \arccos x)| \le 1$.
It takes $N+1$ Chebyshev sample points to get a series of order $N$.
The accuracy of a Chebyshev series approximation to an oscillatory function generally bounces around the amplitude of the oscillations until the number is sufficiently large. The approximation cannot really get a grip on the function until there is at least one point per extrema, but often, especially for irregular oscillations, it has will be considerable more. When convergence starts, it will be rapid for an analytic function, and the error can estimated from the last few coefficients of the Chebyshev approximation.
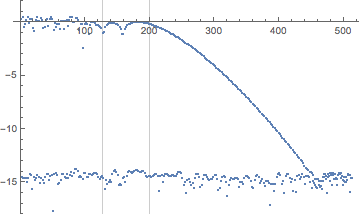
The term Sin[200 Cos[Pi x/2]^8 x] used in the extremely oscillatory example above has a "maximum frequency" of 200 / (2 Pi) near x == 0. That would translate to about 127 extrema. We can see that the Chebyshev coefficients $c_k$ start to settle down around $k = 127$, but they do not start their convergence to zero until $k$ is more than $200$. At $k = 460$, the approximation reaches the limit of machine precision. (Note also that the function is odd, which means the odd-order Chebyshev coefficients are theoretically zero. The function also has some very flat minima, which causes FindMinimum to complain.)
obj = Sin[200 Cos[Pi x/2]^8 x];
chebMinimize[obj, {x, -1, 1}, "SuppressMessages" -> All];  (* load cheb`data *)
cdata = RealExponent@cheb`data["C"];
ListPlot[cdata, PlotRange -> {-18, 2}, GridLines -> {{127, 200, 460}, None}]
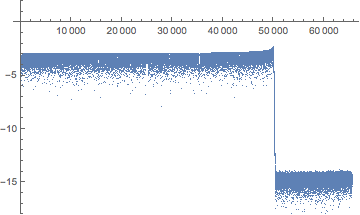
A similar thing happens with the other term Sin[50000 x + 1]/1000, except that convergence does not start until we have about 50000 points. Note that the level of the pre-convergent phase is about the amplitude of the function, 1/1000.
obj = Sin[50000 x + 1]/1000;
chebMinimize[obj, {x, -1, 1}, MaxRecursion -> 20, "MaxMinima" -> 100]; (* load cheb`data *)
cdata = RealExponent@cheb`data["C"];
ListPlot[cdata, PlotRange -> {-18, 2}]
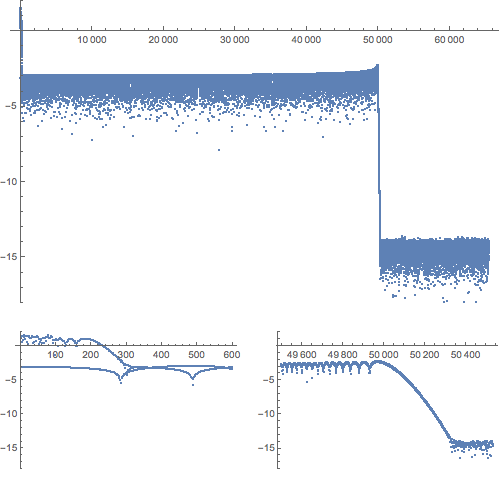
The full example is a combination of these two processes. Note that oddness of the second term is reflected in the plateau at 10^-3, which is magnitude of the first term (lower left).
In general, one should expect that for the algorithm to be guaranteed to be successful, the approximation should have an error much less than this minimum amplitude of the oscillations.
When this is not known, one can see that a machine-precision approximation is possible. If the oscillations of this order, then it will hopeless anyway, unless the working precision is increased.
obj = Sin[50000 x + 1]/1000 + Sin[200 Cos[Pi x/2]^8 x];
chebMinimize[obj, {x, -1, 1}, MaxRecursion -> 20, "MaxMinima" -> 100]; (* load cheb`data *)
cdata = RealExponent@cheb`data["C"];
ListPlot[cdata, PlotRange -> {-18, 2}]
GraphicsRow[
 Module[{i, j, plot},
  plot := ListPlot[cdata[[i ;; j]], DataRange -> {i, j}, PlotRange -> {-18, 2}];
  {i = 1; j = 600; plot,
   i = 49500; j = Length@cdata - 15000; plot}
  ], ImageSize -> 500]
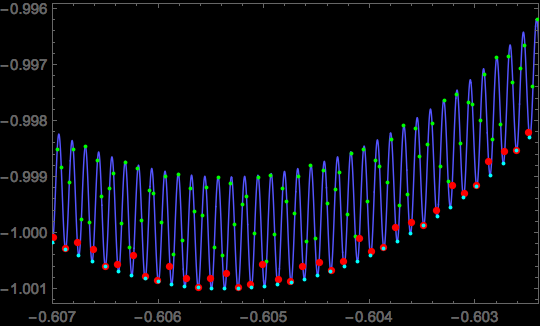
Here is a closer look at the sampling and local minima. The sample points are shown in green and red, with the red one being the seeds for FindMinimum. The local minima returned by FindMinimum are in cyan.
With[{samples = Transpose@{cheb`data["X"], cheb`data["Y"]}},
 Plot[obj, {x, -1, 1},
  PlotPoints -> 60, PlotStyle -> {Thickness[0.003], Lighter@Blue},
  Background -> Black,
  Epilog -> {PointSize[0.004],
    Green, Point[samples],
    PointSize[0.012], Red, Point@samples[[cheb`data["M"]]],
    PointSize[0.005], Cyan,
    Point[{x, obj} /. cheb`data["FM"][[All, 2]]]},
  Frame -> True, PlotRangePadding -> {0, Scaled[.05]}]
 ]
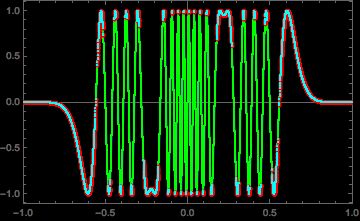
Here is a close-up of the region where the absolute minimum was found. We can see that there are at least three sample points per oscillation, just enough to identify good seeds for FindMinimum, and that every local minimum has been found.
With[{samples = Transpose@{cheb`data["X"], cheb`data["Y"]}},
 Plot[obj, {x, -0.607, -0.6024},
  PlotPoints -> 60, PlotStyle -> {Thickness[0.003], Lighter@Blue},
  Background -> Black,
  Epilog -> {PointSize[0.008],
    Green, Point[samples],
    PointSize[0.015], Red, Point@samples[[cheb`data["M"]]],
    PointSize[0.008], Cyan,
    Point[{x, obj} /. cheb`data["FM"][[All, 2]]]},
  Frame -> True, PlotRangePadding -> {0, Scaled[.05]}]
 ]



NMinimizeorFindMinimum? Take a look at the tutorial here. For example, tryNMinimize[Sin[10 x^2] + 5 Cos[20 x], {x}, Method -> {"RandomSearch", "SearchPoints" -> 500}]. $\endgroup$