4
$\begingroup$

I'm making the ticks labels of my plot using the rule:

FrameTicks -> {{N@FindDivisions[{Min@data1, Max@data2}, 6], None},
    {Range[1960, 2015, 10], None}}

This is generating the ticks I want on both axes pretty well. The only problem is that the y-axis ticks vary in the number of decimal places, which I do not want. Is there a way to make all those numbers have the same number of decimal places as the one with the most decimal places?

I wanted to use something like NumberForm[ticks, {∞, n}] with ticks being the N@..., 6] above, but I'm not sure what n should be to just go with the tick mark with the most decimal places.

Thank you!

$\endgroup$
0

1 Answer 1

5
$\begingroup$

First, generate the ticks and their labels with whatever range is desired.

ticks[min_, max_] := Module[{d = FindDivisions[{min, max}, 6], n}, 
    n = Ceiling@Log10@Max@Denominator@d; {#, NumberForm[#, {∞, n}]} & /@ N@d]

For instance,

t = ticks[.01,.03]
(* {{0.01, NumberForm[0.01, {∞, 3}]}, {0.015, NumberForm[0.015, {∞, 3}]}, 
    {0.02, NumberForm[0.02, {∞, 3}]}, {0.025, NumberForm[0.025, {∞, 3}]}, 
    {0.03, NumberForm[0.03, {∞, 3}]}} *)

(The Output actually looks like enter image description here .)

They can then be used as, for instance,

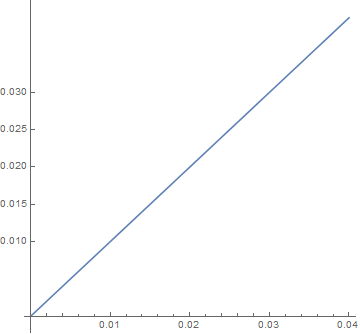
Plot[x, {x, 0, .04}, Ticks -> {Automatic, t}, AspectRatio -> 1]

enter image description here

$\endgroup$
5
  • $\begingroup$ Thank you! Then my only issue is generating that number (n, or 3) of decimal places. This is actually inside a loop that generates 36 graphs; how can I automate determining how many decimal places to make? Some graphs need 2, 3, or 4 decimal places. $\endgroup$ Commented Sep 10, 2016 at 15:52
  • $\begingroup$ @user3769181, n is computed in the function ticks. (Or, do I misunderstand your comment?) $\endgroup$
    – bbgodfrey
    Commented Sep 10, 2016 at 15:55
  • $\begingroup$ I think maybe I just didn't understand what's happening in the function. It's starting to make sense; what is # doing? $\endgroup$ Commented Sep 10, 2016 at 16:19
  • $\begingroup$ @user3769181 The function {#, NumberForm[#, {∞, n}]} & /@ N@d maps each element of N@d (which is a list of the locations of the ticks), into a list of locations and formatted tick labels (the list of pairs enclosed in (* *) in the answer). Review the documentation of Map for details. Later, Plot puts each tick label at the corresponding tick location. Review the documentation of Ticks for details. $\endgroup$
    – bbgodfrey
    Commented Sep 10, 2016 at 16:26
  • $\begingroup$ Alright, fantastic. This works well. Thank you so much! $\endgroup$ Commented Sep 10, 2016 at 16:33

Your Answer

By clicking “Post Your Answer”, you agree to our terms of service and acknowledge you have read our privacy policy.

Not the answer you're looking for? Browse other questions tagged or ask your own question.