3
$\begingroup$

I am trying to use a recurrence plot to pinpoint the location when a system re-visits a previous point in its phase portrait. The system (a thin liquid film) is governed by a non-linear differential equation and is quite easily solved using NDSolve as shown:

{xMin, xMax} = {-(π/0.0677), π/0.0677}; 
k = 0.0677; 
TMax = 1650; 
m = 5; 
S = 100; 
Ga = -3^(-1); 
Quiet[uSolpbc = 
     u /. NDSolve[{D[u[t, x], 
        t] == (-S)*D[u[t, x]^3*D[u[t, x], x, x, x], x] + 
                 Ga*D[u[t, x]^3*D[u[t, x], x], x] - 
        m*D[(u[t, x]/(1 + u[t, x]))^2*
                       D[u[t, x], x], x], 
      u[0, x] == 1 - 0.01*Cos[k*x], u[t, xMin] == u[t, xMax],                  
      Derivative[0, 1]*u[t, xMin] == Derivative[0, 1]*u[t, xMax],                  
      Derivative[0, 2]*u[t, xMin] == Derivative[0, 2]*u[t, xMax],                  
      Derivative[0, 3]*u[t, xMin] == Derivative[0, 3]*u[t, xMax]}, 
     u, {t, 0, TMax}, {x, xMin, xMax}, MaxSteps -> 100000, 
     Method -> {"MethodOfLines", "Method" -> "LSODA", "TemporalVariable" -> t,"SpatialDiscretization" ->                      {"TensorProductGrid", "MinPoints" -> 800, "MaxPoints" -> 1200, 
                  "DifferenceOrder" -> 5}}][[1]]]

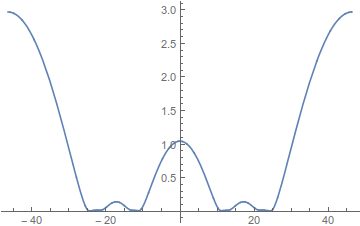
The film profile is plotted as:

Plot[uSolpbc[0.99 TMax, x], {x, xMin, xMax}]

film profile

I am coding the Recurrence Plot in a block:

Block[{stepSize = 2, end = TMax, tt, ττ, rd},
 rd = ParallelTable[
   UnitStep[
    0.01 - Norm[uSolpbc[tt, 0] - uSolpbc[ττ, 0], 2]], {tt, 
    0, end, stepSize}, {ττ, 0, end, stepSize}];
 MatrixPlot[rd]]

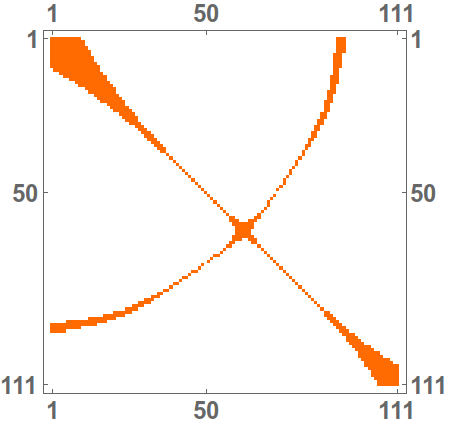
recurrence plot, rough version

The grainy nature of the plot can be improved by choosing a smaller time step; say, stepSize = 1/20 or less. However, the current stepSize of 2 itself is quite slow (Timing reveals 0.344 seconds; AbsoluteTiming reveals 3.33 seconds).

I have a feeling that it is the nested nature of these functions (ParallelTable, UnitStep and Norm) that is taking a long time. Is there some way I can improve this? Currently, choosing a much smaller time step leads to an "out of memory" error (I have ~ 8 GB of memory that is exhausted!).

It is not Nest or Map that I am looking for, and if it is, I guess I am lost on its application in this case.

$\endgroup$
1
  • $\begingroup$ You can use Table or get the definition of the interpolating function to the subkernels, I think. $\endgroup$
    – user21
    Commented Jun 24, 2016 at 2:32

2 Answers 2

6
$\begingroup$

One can use the new function DistanceMatrix[] for the purpose; this avoids repeated computations (since the underlying matrix is symmetric).

With[{stepSize = 2, end = TMax},
     MatrixPlot[UnitStep[0.01 - DistanceMatrix[uSolpbc[Range[0, end, stepSize], 0]]]]]

and your plot is produced very quickly, without the need to invoke parallelization.

$\endgroup$
6
  • $\begingroup$ Elegant in its simplicity and requires about 2/7 the time of my solution. (+1). $\endgroup$
    – bbgodfrey
    Commented Jun 24, 2016 at 5:28
  • $\begingroup$ ...and if you hadn't tried it out yet, @drN, you could go as fine as stepSize = 1/2 with little effort! $\endgroup$ Commented Jun 24, 2016 at 13:09
  • $\begingroup$ Just did. Thank you - it works great! Could you however also add that this needs Needs["HierarchicalClustering`"] in your answer? Without that, I get an error message. Really nice solution. $\endgroup$
    – dearN
    Commented Jun 24, 2016 at 13:16
  • $\begingroup$ It's supposed to be built-in in version 10... from your comment, I presume you're on an older version? $\endgroup$ Commented Jun 24, 2016 at 13:22
  • $\begingroup$ I have 10.2? I suppose the latest version is >10.2 then. Need to check with my university if they can update. $\endgroup$
    – dearN
    Commented Jun 24, 2016 at 17:10
3
$\begingroup$

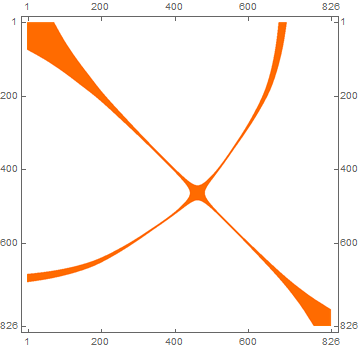
The plot in the question must have been obtained with stepSize = 15, not stepSize = 2. Using the latter value gives a smooth plot,

enter image description here

The computation takes about 78 sec on my PC. To address the specific issue in the question, the run time can be reduced by two orders of magnitude using

Block[{stepSize = 2, end = TMax, tt, rd}, 
    tSolpbc = Table[uSolpbc[tt, 0], {tt, 0, end, stepSize}]; 
    rd = ParallelTable[
        UnitStep[0.01 - Norm[tSolpbc[[nt]] - tSolpbc[[nτ]], 2]], 
        {nt, end/stepSize}, {nτ, end/stepSize}]; MatrixPlot[rd]]

which produces the same plot. Evidently, most of the run time used in the original computation was consumed by computing uSolpbc (end/stepSize)^2 times. The revised computation computes it only end/stepSize times.

$\endgroup$
1
  • $\begingroup$ You are correct, my mistake... the stepSize was indeed 15. I was thinking "2" in my head. Thank you for the solution. $\endgroup$
    – dearN
    Commented Jun 24, 2016 at 13:06

Your Answer

By clicking “Post Your Answer”, you agree to our terms of service and acknowledge you have read our privacy policy.

Not the answer you're looking for? Browse other questions tagged or ask your own question.