9
$\begingroup$

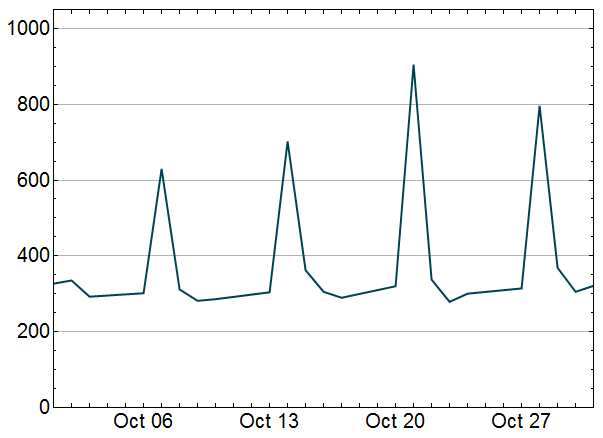
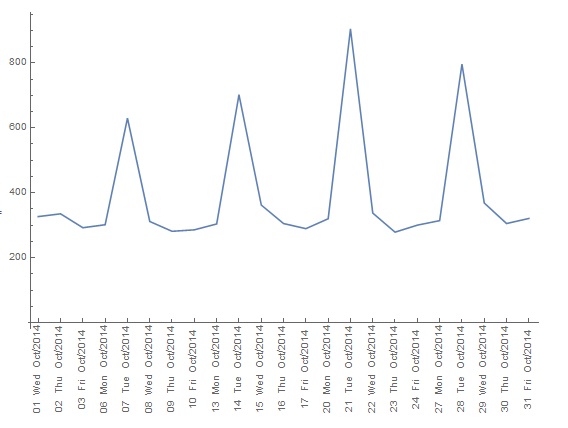
How to skip weekends in DateListPlot, ie, drawing 20 something data points for a month and not leaving 2 days gap between weeks? Currently DateListPlot occupied the actual number of days for a month and drawing a direct line between Friday and next Monday (where no weekend data available).

I want to draw something like this as Excel: Weekends skipped in Excel
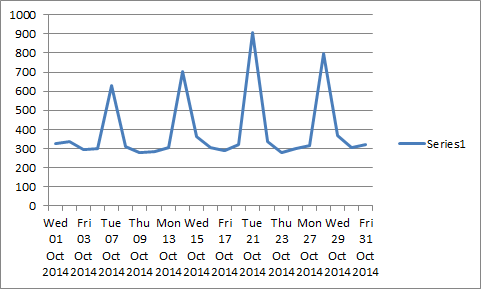
While I get this in Mathematica: Weekends included

Sample data:

Dataset1 = {{{2014, 10, 1, 0, 0, 0}, 
326.8442322}, {{2014, 10, 2, 0, 0, 0}, 
335.284444}, {{2014, 10, 3, 0, 0, 0}, 
292.5086867}, {{2014, 10, 6, 0, 0, 0}, 
301.6750855}, {{2014, 10, 7, 0, 0, 0}, 
629.9616564}, {{2014, 10, 8, 0, 0, 0}, 
311.6753747}, {{2014, 10, 9, 0, 0, 0}, 
281.5024327}, {{2014, 10, 10, 0, 0, 0}, 
285.9985823}, {{2014, 10, 13, 0, 0, 0}, 
304.0455324}, {{2014, 10, 14, 0, 0, 0}, 
702.0810431}, {{2014, 10, 15, 0, 0, 0}, 
362.4479495}, {{2014, 10, 16, 0, 0, 0}, 
305.3800495}, {{2014, 10, 17, 0, 0, 0}, 
289.6995727}, {{2014, 10, 20, 0, 0, 0}, 
320.0506679}, {{2014, 10, 21, 0, 0, 0}, 
904.8753329}, {{2014, 10, 22, 0, 0, 0}, 
337.5214556}, {{2014, 10, 23, 0, 0, 0}, 
278.8865421}, {{2014, 10, 24, 0, 0, 0}, 
300.4519167}, {{2014, 10, 27, 0, 0, 0}, 
314.3109259}, {{2014, 10, 28, 0, 0, 0}, 
796.3015273}, {{2014, 10, 29, 0, 0, 0}, 
368.7108282}, {{2014, 10, 30, 0, 0, 0}, 
305.3858455}, {{2014, 10, 31, 0, 0, 0}, 321.1488558}};

g1 = DateListPlot[Dataset1, PlotRange -> {0, 1050}]
$\endgroup$
2
  • $\begingroup$ Please provide some data and the code you used to get the plot. $\endgroup$
    – Edmund
    Commented Mar 7, 2016 at 3:36
  • $\begingroup$ I've updated the sample graphs with data $\endgroup$
    – Leonx
    Commented Mar 7, 2016 at 4:16

2 Answers 2

6
$\begingroup$

I don't think this is logic to be done using DateListPlot because that will contradict the main idea of DateListPlot (as far as I understand DateListPlot).

In my opinion the easy way is to use the normal ListLinePlot.

data2 = MapAt[
   DateString[#, {"Day", "  ", "DayNameShort", "  ", "MonthNameShort",
       "/", "Year"}] &, Dataset1, {;; , 1}];
tiks = Transpose[{Range@Length[data2],Rotate[#, Pi/2] & /@ data2[[;; , 1]]}];
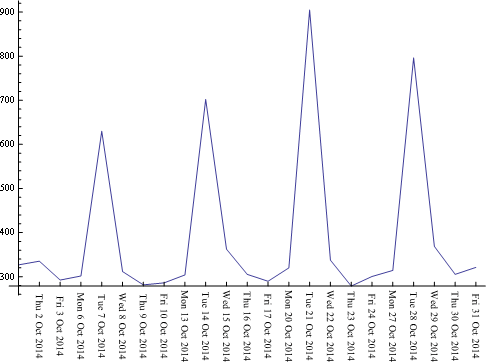
ListLinePlot[data2[[;; , 2]], PlotRange -> All,Ticks -> {tiks, Automatic}]

enter image description here

$\endgroup$
3
  • $\begingroup$ I see... thanks! I suppose same goes to DateListBarChart (ie, using BarChart instead)? $\endgroup$
    – Leonx
    Commented Mar 7, 2016 at 5:52
  • 3
    $\begingroup$ @Leonx - DateListBarChart is not a built-in Mathematica function. It is a custom function that was written by someone in your organisation. $\endgroup$
    – Verbeia
    Commented Mar 7, 2016 at 6:45
  • $\begingroup$ @Verbeia, I am sorry, I didn't read carefully enough. $\endgroup$
    – Leonx
    Commented Mar 7, 2016 at 22:52
5
$\begingroup$
ListLinePlot[d1[[All, 2]], PlotRange -> All, 
 Ticks -> {Transpose[{Range@Length@d1, Rotate[#, -Pi/2] & /@ (DateString[#, "DateShort"] 
           & /@ d1[[All, 1]])}], Automatic}]

Mathematica graphics

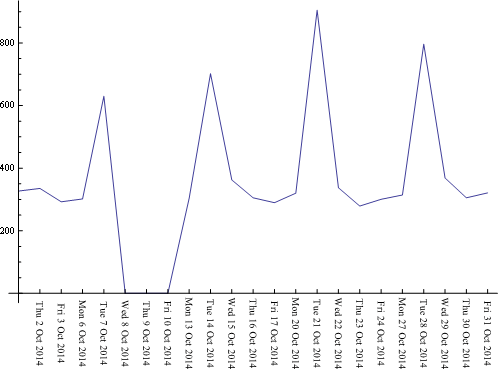
if your list contains "holes", you'll need to fill them up for the plot to be meaningful:

d2 = Join[d1[[;; 5]], d1[[9 ;;]]];
r = DateRange[d2[[All, 1]][[1, ;; 3]], d2[[All, 1]][[-1, ;; 3]]]
d3 = SortBy[Join[d2, {#, 0} & /@ Select[Complement[r, d2[[All, 1, ;; 3]]], 
     DayName@# != Sunday && DayName@# != Saturday &]], AbsoluteTime[#[[1]]] &]
ListLinePlot[d3[[All, 2]], PlotRange -> All, 
 Ticks -> {Transpose[{Range@Length@d3, Rotate[#, -Pi/2] & /@ (DateString[#, "DateShort"] & /@ 
        d3[[All, 1]])}], Automatic}]

Mathematica graphics

$\endgroup$

Your Answer

By clicking “Post Your Answer”, you agree to our terms of service and acknowledge you have read our privacy policy.

Not the answer you're looking for? Browse other questions tagged or ask your own question.