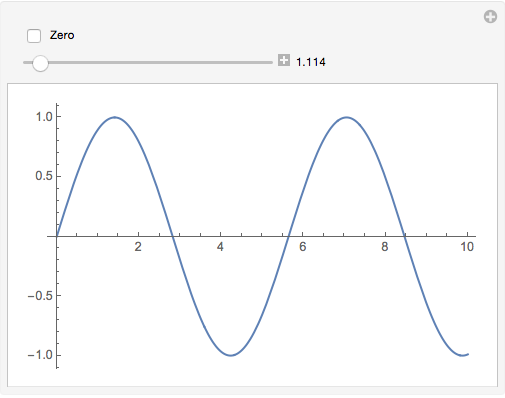
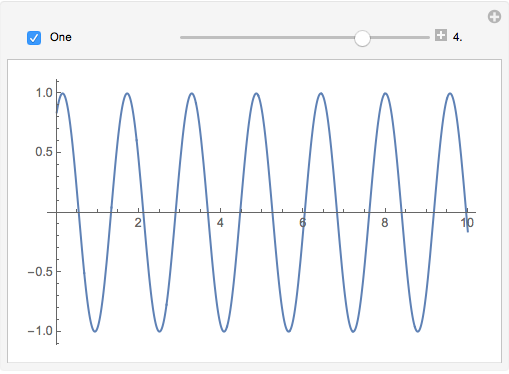
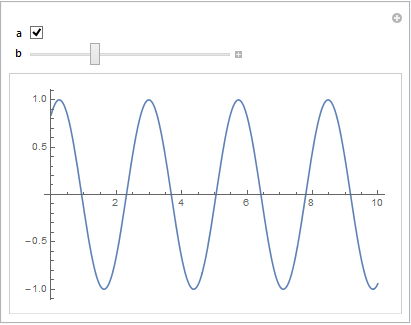
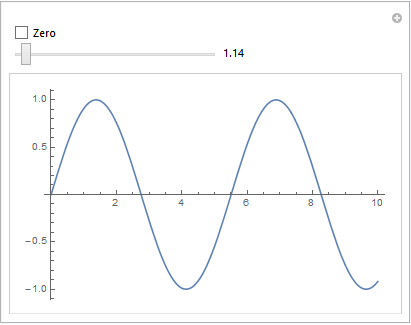
I'm looking for a simple example about how to add a simple On-Off switch in a manipulate function.
More specifically, I defined a curve with two parameters. One is a continuous parameter that is changed using the manipulate slider. The other one is a discrete parameter that takes two values only : 0 or 1. I need to put that parameter as a check box in the manipulate output, above the continuous slider. The check box should have a small line of text, which changes if the box is in its 0 state or its 1 state.
This is certainly very basic, but I can't find any clear example anywhere.
How can I implement what I described?


Manipulate[Plot[Sin[a x], {x, 0, 10}], {a, 0, 1, 1}]$\endgroup$