7
$\begingroup$

I am trying to obtain 2D FFT of an image. From the 2D FFT, I wish to calculate the amplitude of the FFT averaged over a circle vs the distance in pixels by varying the radius of the pixels which is effectively the distance in pixels.

The FFT of the original image is obtained by the following code. The scale bar for the original image is roughly like this: Distance in pixels = 4 Distance in scale = 1 micrometer.

Code to evaluate 2D FFT:

data = Binarize[Dilation[image, 1]]

Dimensions[ImageData[data]]; //this step is just for checking purposes

Imgdata = ImageData[data]

Since I have already binarized the image, the dimension of the image will be of the form M X N The main steps for the Fourier Transform:

FWData = Imgdata

FWData = FWData*(-1)^Table[i + j, {i, IRow}, {j, ICol}]

fw = Fourier[FWData, FourierParameters -> {1, -1}]

Magnification Factor is just for adjusting the intensity of the FFT image which I have observed in some cases is too light

MagnificationFactor = 1

abs = MagnificationFactor*Log[1 + Abs@fw]

Image[abs/Max[abs]]

Finally, I arive at the following image giving the 2D FFT amplitude spectrum. 2d FFT of the image
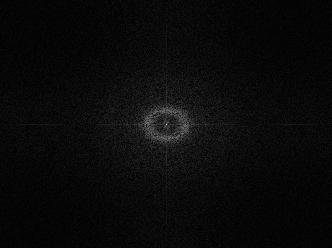
Black = 0 and white = 1

Now what I have to do is to plot the amplitude of the FFT averaged over circles with respect to distance in pixels.I wanted to find the centre of the image and then assume a circle with a certain radius and average the FFT amplitude over that radius and continue by changing the radius.

Once, we get the plot we can change the distance in pixels to the real world distance using the scale bar.

Any help will be highly appreciated.

$\endgroup$
2
  • $\begingroup$ Four questions on this site and you still don't format your posts properly. Please, go to the help centre and read more about the topic. $\endgroup$
    – Sektor
    Commented Jun 30, 2015 at 10:47
  • 2
    $\begingroup$ @Sektor, I am sorry. I have made the modifications and hope this makes the question clear and convincing. $\endgroup$
    – Matcax
    Commented Jun 30, 2015 at 11:20

2 Answers 2

11
$\begingroup$

You didn't post a sample image, so I'll use the Lena test image:

img = ColorConvert[ExampleData[{"TestImage", "Lena"}], "Grayscale"];

fft = Fourier[ImageData[img]];
fft = RotateLeft[fft, Floor[Dimensions[fft]/2]];

(RotateLeft is basically equivalent to *(-1)^Table[i + j, {i, IRow}, {j, ICol}] in your code: it shifts the 0/0 frequency to the center of the result image)

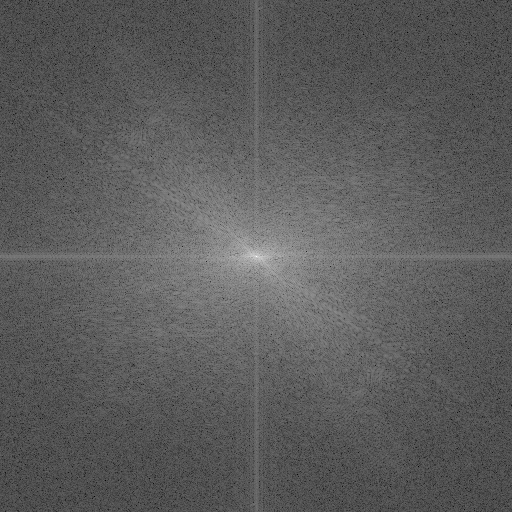
Image[Rescale[Log[Abs[fft] + 10.^-10]]]

enter image description here

Now I can use ImageTransformation to convert this image to polar coordinates:

radius = Sqrt[Total[Dimensions[fft]^2]]/2.;
fftPolar = 
 ImageTransformation[
  Image[Abs[fft]], {Cos[#[[1]]], Sin[#[[1]]]} #[[2]] &, 
  Round[{\[Pi]*radius, radius}], PlotRange -> {{0, 2 \[Pi]}, {0, 1}}, 
  DataRange -> {{-1, 1}, {-1, 1}}]

enter image description here

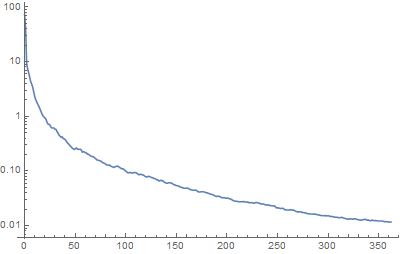
Every horizontal line in this image corresponds to a concentric ring around the center in the original FFT. So we can just calculate the mean of each line:

ListLogPlot[Mean /@ ImageData[fftPolar, DataReversed -> True], 
    DataRange -> {0, radius}, Joined -> True]

enter image description here

Doing the same with your image yields:

enter image description here

$\endgroup$
4
  • 1
    $\begingroup$ Thank you for the help. But I couldn't understand that why is there this exponential background behaviour in the plot of amplitude vs pixel nos. image? $\endgroup$
    – Matcax
    Commented Jul 12, 2015 at 9:31
  • $\begingroup$ @nikie Great +1, how to you obtain the phase image? phasesData = Arg@fft; Image[phasesData /Max[phasesData]] $\endgroup$
    – mrz
    Commented Feb 19, 2016 at 16:02
  • 1
    $\begingroup$ Or Image[Rescale[Arg[fft]]]. Not sure what you expect to see in it, though $\endgroup$ Commented Feb 19, 2016 at 17:43
  • $\begingroup$ Can you have a look on the following question: mathematica.stackexchange.com/questions/195288/… $\endgroup$
    – mrz
    Commented Apr 17, 2019 at 18:44
0
$\begingroup$

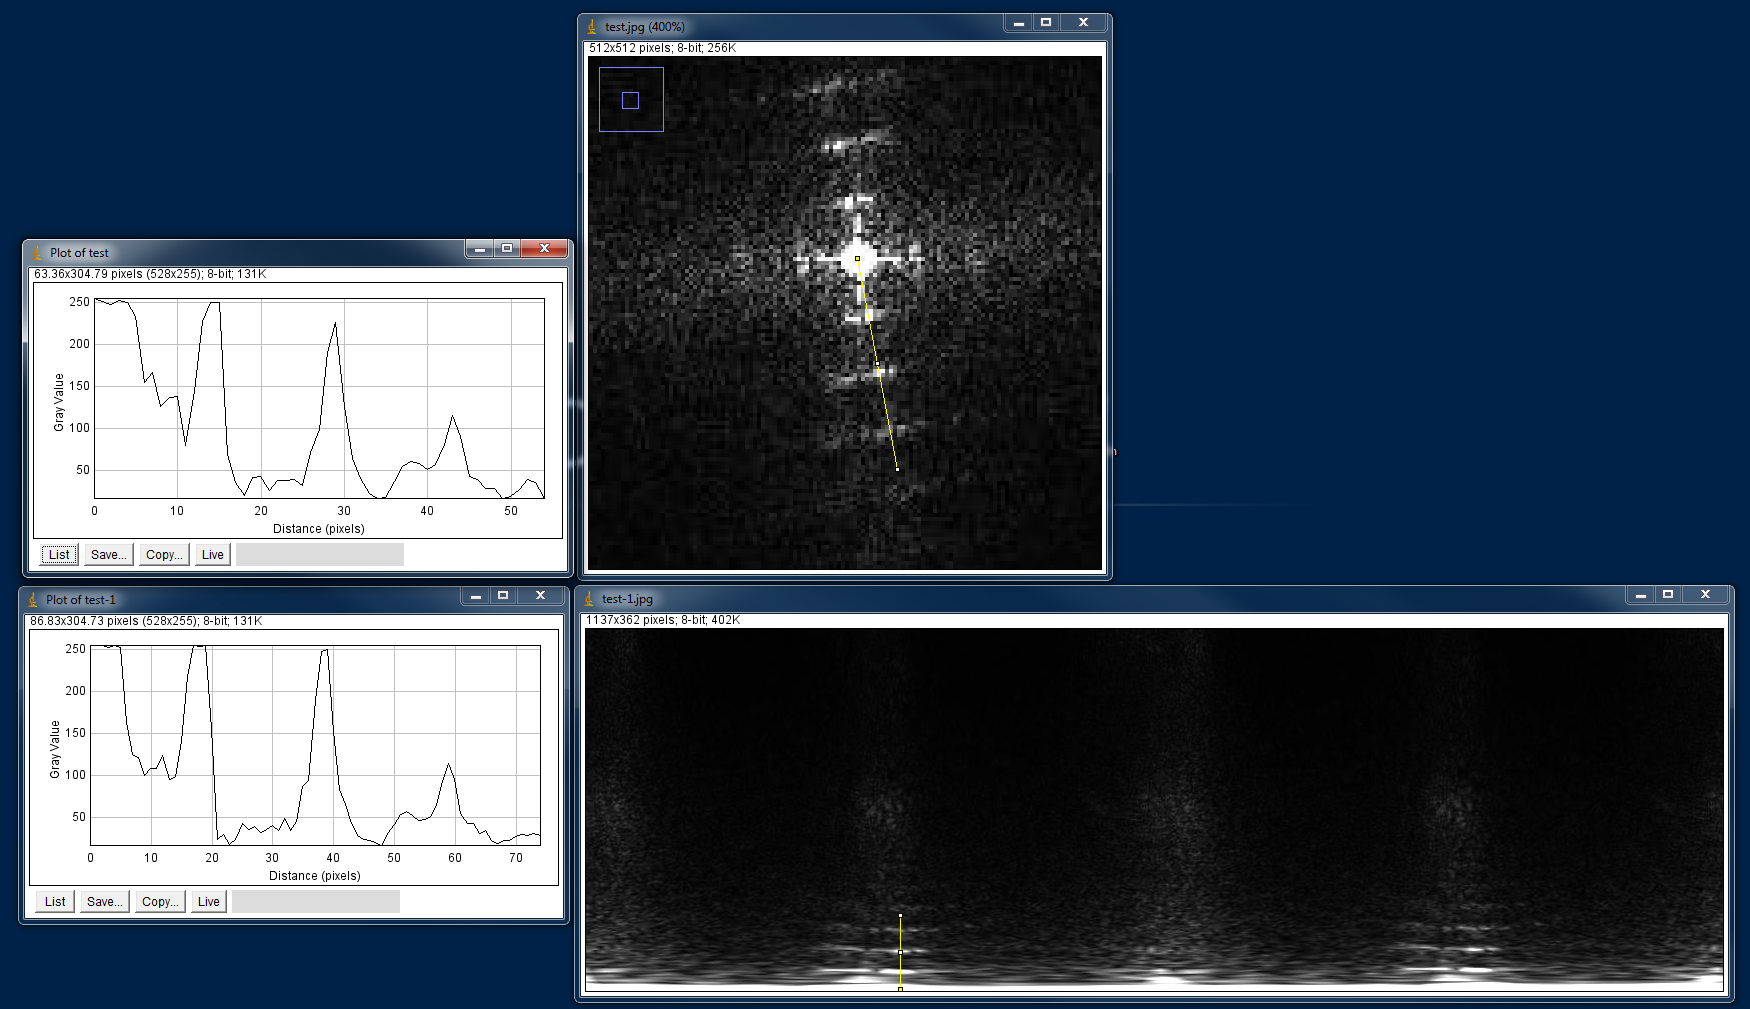
Thank you for this. However, there is a problem when going from Cartesian to polar coordinate. The image is distorted. On my image the peaks are shifted, I joined measurements performed with ImageJ to illustrate it.

Edit: I recommend to use this method to change coordinate. Note you'll have to change the following line. {center, radius} = {ImageDimensions[img]/2, ImageDimensions[img][[1]]}; .

Cartesian and polar images Best, Louis.

$\endgroup$
1
  • 1
    $\begingroup$ Hello, and welcome to Mathematica Stack Exchange. You need to be aware that this is not a traditional discussion forum and new questions, even implied ones such as yours, are better posted as new Questions, with a link back to the original. Please see the tour for more. $\endgroup$
    – Mr.Wizard
    Commented Aug 18, 2016 at 15:58

Your Answer

By clicking “Post Your Answer”, you agree to our terms of service and acknowledge you have read our privacy policy.

Not the answer you're looking for? Browse other questions tagged or ask your own question.