Edit
Here is a version that avoids the use of Inset and instead uses Overlay. I think this version covers all of the OPs requests. I have not tried to functionalize the code at this point since there will likely be some tweaking of parameters based on the actual functions plotted.
optsall = {Axes -> False, Frame -> True, ImageSize -> 600,
   BaseStyle -> {Thick, FontSize -> 14}};
opts1 = {ImagePadding -> {{Scaled[0.05], Scaled[0.11]}, {Scaled[0.04],
       Scaled[0.02]}},
   FrameStyle -> {Thick, {Thick, Blue}, Thick, Opacity[0]},
   FrameLabel -> {"x", "First y-label"}};
opts2 = {ImagePadding -> {{Scaled[0.05], Scaled[0.11]}, {Scaled[0.04],
       Scaled[0.02]}},
   FrameStyle -> {Opacity[0], Opacity@0, Opacity@0, Green},
   FrameTicks -> All,
   FrameLabel -> ConstantArray["Second y-label", 4]};
opts3 = {ImagePadding -> {{Scaled[0.11], Scaled[0.05]}, {Scaled[0.04],
       Scaled[0.02]}},
   FrameStyle -> {Opacity[0], Opacity@0, Opacity@0, Red},
   FrameTicks -> All, FrameLabel -> ConstantArray["Third y-label", 4]};
Overlay[{
  Plot[{x, Rescale[x^2, {0, 100}, {0, 10}],
      Rescale[x^3, {0, 1000}, {0, 10}]}, {x, 0, 10},
     PlotStyle -> {Blue, Green, Red},
     ##, PlotLegends ->
      Placed[LineLegend[{"y = x", "y = x^2", "y = x^3"},
        LegendFunction -> (Framed[#] &)], Scaled[{0.15, 0.8}]]] & @@
   Join[optsall, opts1],
  Plot[x^2, {x, 0, 10}, PlotStyle -> None,
     ##] & @@ Join[optsall, opts2],
  Plot[x^3, {x, 0, 10}, PlotStyle -> None, ##] & @@
   Join[optsall, opts3]

  }]
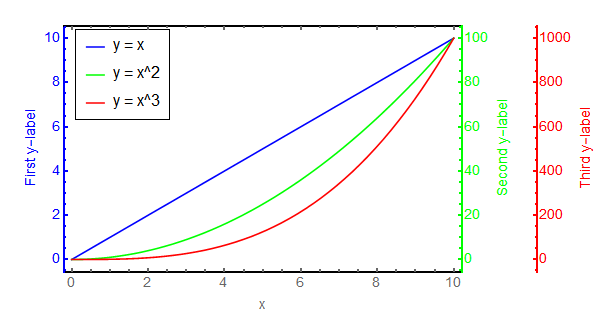
Combining Overlay with ImagePadding allowed me to avoid some resizing problems with Inset. I received a little bit of inspiration from this answer which allowed me to organize the options nicely.
Old version, since this is the one that was accepted as the answer
Here is my attempt, which should be considered a work in progress. There are some things I want to add, but I also have to do some chores. I figured an incomplete answer to whet one's whistle is better than none.
Clear[threeyaxisplot];
threeyaxisplot[{f1_, f1label_}, {f2_, f2label_}, {f3_, f3label_},
  range : {var_Symbol, vmin_?NumericQ, vmax_?NumericQ}] :=
 Module[{plot1, plot2, plot3, p1yrng, p2yrng, p3yrng, p2yaxis,
   p3yaxis},
  {
   {plot1, plot2, plot3} =
    Plot[#[var], range, Axes -> False,
       Frame -> {True, True, False, False},
       PlotRangeClipping -> False] & /@ {f1, f2, f3}
   };
  {p2yaxis, p3yaxis} =
   Plot[(First@#)[var], range, Axes -> False,
      Frame -> {False, True, False, False}, PlotStyle -> White,
      FrameLabel -> {None, Last@#}] & /@ {{f2, f2label}, {f3,
      f3label}};
  {p1yrng, p2yrng, p3yrng} =
   Last@(PlotRange /. Options[#, PlotRange]) & /@ {plot1, plot2,
     plot3};
  Plot[{f1[var], Rescale[f2[var], p2yrng, p1yrng],
    Rescale[f3[var], p3yrng, p1yrng]}, range,
   PlotRangeClipping -> False,
   Axes -> False, Frame -> {True, True, False, False},
   FrameLabel -> {None, f1label},
   Epilog -> {
     Inset[p2yaxis, Scaled@{1.6, 0.5}, Scaled@{0.5, 0.5}, [email protected]],
     Inset[p3yaxis, Scaled@{1.85, 0.5}, Scaled@{0.5, 0.5},
      [email protected]]},
   ImagePadding -> {{Automatic, 130}, {Automatic, Automatic}}]
  ]
out = threeyaxisplot[{# &, "function1"}, {#^2 &, "function2"}, {#^3 &,
    "function3"}, {x, 0, 10}]
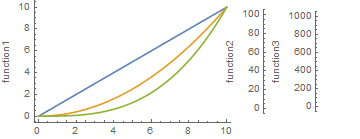
My approach is to plot all three functions on the same axes using Rescale and then take the original axis from the 2nd and 3rd plots and use Inset to place them on this rescaled plot. There's some tweaking that needs to be done:
- Using the right-hand frame as opposed to the left-hand frame for axes 2 and 3 should make the formatting of the right hand axes more traditional
- The colors of the 2nd and 3rd axes should be changed to match the plot colors
threeyaxisplot needs some work in the function definition. For example, I cannot currently write threeyaxisplot[{x, "label"},{x^2,"label"}....] and need to pass pure functions instead.
I plan on addressing these after the chores are done :-)
