Suppose that I have matrix matT1 at time t and matT2 at time t+1:
matT1 = {
         {0.98, 0.95, 1.00, 0.85, 1.40},
         {1.46, 0.36, 0.96, 0.15, 0.97},
         {0.24, 1.20, 1.40, 0.96, 0.46},
         {1.10, 1.30, 0.03, 0.81, 0.53},
         {1.30, 1.50, 1.30, 0.51, 0.42}
       };

matT2 = {
         {0.44, 1.00, 0.77, 1.20, 0.61},
         {0.58, 0.57, 0.65, 0.19, 1.00},
         {1.40, 0.14, 1.20, 1.40, 0.96},
         {1.40, 0.95, 0.74, 0.56, 0.47},
         {0.98, 0.45, 1.30, 0.34, 0.25}
       };
Note that these matrices represent two different weighted directed graphs with 5 vertices. Elements of these two matrices are assigned to one of the five states s1=[0, 0.5], s2=(0.5, 1], s3=(1, 1.5] etc.
r1T1=BoolEval[0<= matT1<=0.5]/.{1->s1};
r2T1=BoolEval[0.5<matT1<= 1]/.{1-> s2};
r3T1=BoolEval[1<matT1<=1.5]/.{1 -> s3};
r4T1=BoolEval[1.5<matT1<=2]/.{1 -> s4};
r5T1=BoolEval[2<matT1<=2.5]/.{1 -> s5};
matT1S = r1T1 + r2T1 + r3T1 + r4T1 + r5T1 // MatrixForm

r1T2=BoolEval[0<=matT2<=0.5]/.{1 -> s1};
r2T2=BoolEval[0.5<matT2<=1]/.{1 -> s2};
r3T2=BoolEval[1<matT2<=1.5]/.{1 -> s3};
r4T2=BoolEval[1.5<matT2<=2]/.{1 -> s4};
r5T2=BoolEval[2<matT2<=2.5]/.{1 -> s5};
matT2S = r1T2 + r2T2 + r3T2 + r4T2 + r5T2 // MatrixForm
respectively yield:
matT1S = {
          {s2, s2, s2, s2, s3},
          {s3, s1, s2, s1, s2},
          {s1, s3, s3, s2, s1},
          {s3, s3, s1, s2, s2},
          {s3, s3, s3, s2, s1}
         };
matT2S = {
          {s1, s2, s2, s3, s2},
          {s2, s2, s2, s1, s2},
          {s3, s1, s3, s3, s2},
          {s3, s2, s2, s2, s1},
          {s2, s1, s3, s1, s1}
         };
We then derive a map of transition from matT1S to matT2Sby manually comparing the states in both matrices.
Clear[n, states, map];
n = Length[matT2S];
states = {s1, s2, s3, s4, s5};
map = {};

Do[
   If[matT1S[[i, j]] == states[[1]] &&
      matT2S[[i, j]] == states[[2]],
      AppendTo[map, {i, j}]
     ], {i, n}, {j, n}
  ]

Length[map]   (* gives 0 *)
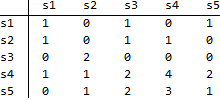
For each pair of states, I run the above code to obtain the following map:
Rows are associated with time t and columns with t+1. This map illustrates that, out of 3 links in state s1 at time t, 1 remains in s1 at t+1, and 1 moves to s3 at t+1 and 1 moves to s5 at t+1. Other numbers in the map should be read likewise. Using this map,
traMap={
         {1,0,1,0,1},
         {1,0,1,1,0},
         {0,2,0,0,0},
         {1,1,2,4,2},
         {0,1,2,3,1}
       };
transMatrix=
  DiagonalMatrix[1/Total[traMap,
  {2}]].traMap
A row-stochastic transition matrix as:
transMatrix = {
    {1/3,   0,    1/3,   0,   1/3},
    {1/3,   0,    1/3,  1/3,   0 },
    {0,     1,     0,    0,    0 },
    {1/10, 1/10,  1/5,  2/5,  1/5},
    {0,    1/7,   2/7,  3/7,  1/7}
  };
and
MatrixPower[transMatrix, 100]
produces the following limiting distribution:
This limiting distribution translates the current vector (3, 3, 2, 10, 7) to (0.17, 0.26, 0.22, 0.23, 0.12)*(3, 3, 2, 10, 7).
My question: Although I found out the transition, I do not know which linkages are in each state in the final period t+100. I like to know the specific linkages associated the new distribution (0.17, 0.26, 0.22, 0.23, 0.12)*(3, 3, 2, 10, 7).
Would it be possible to write a function transMatrix[matrixT_,matrixT1_]:=... to produce: a transition matrix (row stochastic matrix), a final distribution of the linkages across three states, and subsets of the linkages across each state?


