added 2 characters in body
Source Link
Tugrul Temel
  • 6.4k
  • 3
  • 14
  • 33

Note that these matrices represent two different weighted directed graphs with 5 vertices. Elements of these two matrices are assigned to one of the threefive states s1=[0, 0.5], s2=(0.5, 1], and s3=(1, 1.5] etc.

r1T1=BoolEval[0<= matT1<=0.5]/.{1->s1};
r2T1=BoolEval[0.5<matT1<= 1]/.{1-> s2};
r3T1=BoolEval[1<matT1<=1.5]/.{1 -> s3};
r4T1=BoolEval[1.5<matT1<=2]/.{1 -> s4};
r5T1=BoolEval[2<matT1<=2.5]/.{1 -> s5};
matT1S = r1T1 + r2T1 + r3T1 + r4T1 + r5T1 // MatrixForm

r1T2=BoolEval[0<=matT2<=0.5]/.{1 -> s1};
r2T2=BoolEval[0.5<matT2<=1]/.{1 -> s2};
r3T2=BoolEval[1<matT2<=1.5]/.{1 -> s3};
r4T2=BoolEval[1.5<matT2<=2]/.{1 -> s4};
r5T2=BoolEval[2<matT2<=2.5]/.{1 -> s5};
matT2S = r1T2 + r2T2 + r3T2 + r4T2 + r5T2 // MatrixForm
Clear[n, states, map];
n = Length[matT2S];
states = {s1, s2, s3, s4, s5};
map = {};

Do[
   If[matT1S[[i, j]] == states[[1]] &&  
      matT2S[[i, j]] == states[[2]], 
      AppendTo[map, {i, j}]
     ], {i, n}, {j, n}
  ]  (* states[[i]] index should be changed for each transition type. This code generates the number of transition (3) from `s1` to `s2` only.*)
 
Length[map]   (* gives 30 *)

enter image description hereenter image description here

Rows are associated with time t and columns with t+1. This map illustrates that, out of 63 links in state s1 at time t, 2 remain1 remains in s1 at t+1, and 3 move1 moves to s2s3 at t+1 and 1 moves to s3s5 at t+1. Other numbers in the map should be read likewise. Using this map,

traMap =traMap={
         {21,30,1,0,1},
         {31,50,1,1,0},
         {0,2,0,0,0}, 
         {1,1,2,4,2},
         {0,1,2,3,1}
       };
transMatrix=
  DiagonalMatrix[1/Total[traMap,
  {2}]].traMap
transMatrix = {
     {1/3,   0,    1/3,   {2/60,  3 1/63},
    {1/6}3, 
   0,    1/3,  1/3,   0 },
    {3/100, 5/10, 2/10}   1,
      0,    0,    0 },
    {21/910, 1/10,  41/95,  32/95,  1/5},
    {0,    1/7,   2/7,  3/7,  1/7}
  };

which is:

enter image description here

and

enter image description hereenter image description here

This limiting distribution translates the current vector (63, 3, 2, 10, 97) to (0.2917, 0.4926, 0.22)*(6, 100.23, 90.12) = *(73,25 3, 12.252, 5.510, 7). This means that states s1 and s2 host more links while state s3 looses its members.

My question: Although I found out the change shown as (7,25, 12.25, 5.5)transition, I do not know which linkages are in each state in the final period t+100. I know that 7.25 will be in state s1 after 100 repetition of transition but which linkages are they? Basically, I like to know the specific linkages associated withthe new distribution (70.2517, 120.2526, 50.522, 0.23, 0.12)*(3, 3, 2, 10, 7).

Note that these matrices represent two different weighted directed graphs with 5 vertices. Elements of these two matrices are assigned to one of the three states s1=[0, 0.5], s2=(0.5, 1], and s3=(1, 1.5].

r1T1=BoolEval[0<= matT1<=0.5]/.{1->s1};
r2T1=BoolEval[0.5<matT1<= 1]/.{1-> s2};
r3T1=BoolEval[1<matT1<=1.5]/.{1 -> s3};
matT1S = r1T1 + r2T1 + r3T1 // MatrixForm

r1T2=BoolEval[0<=matT2<=0.5]/.{1 -> s1};
r2T2=BoolEval[0.5<matT2<=1]/.{1 -> s2};
r3T2=BoolEval[1<matT2<=1.5]/.{1 -> s3};
matT2S = r1T2 + r2T2 + r3T2 // MatrixForm
Clear[n, states, map];
n = Length[matT2S];
states = {s1, s2, s3};
map = {};

Do[
   If[matT1S[[i, j]] == states[[1]] &&  
      matT2S[[i, j]] == states[[2]], 
      AppendTo[map, {i, j}]
     ], {i, n}, {j, n}
  ]  (* states[[i]] index should be changed for each transition type. This code generates the number of transition (3) from `s1` to `s2` only.*)
 
Length[map]   (* gives 3 *)

enter image description here

Rows are associated with time t and columns with t+1. This map illustrates that, out of 6 links in state s1 at time t, 2 remain in s1 at t+1, and 3 move to s2 at t+1 and 1 moves to s3 at t+1. Other numbers in the map should be read likewise. Using this map,

traMap ={{2,3,1},{3,5,2},{2,4,3}};
transMatrix=
  DiagonalMatrix[1/Total[traMap,
  {2}]].traMap
transMatrix = {
               {2/6,  3/6,  1/6}, 
                {3/10, 5/10, 2/10},
                {2/9,  4/9,  3/9}
             };

which is:

enter image description here

and

enter image description here

This limiting distribution translates the current vector (6, 10, 9) to (0.29, 0.49, 0.22)*(6, 10, 9) = (7,25, 12.25, 5.5). This means that states s1 and s2 host more links while state s3 looses its members.

My question: Although I found out the change shown as (7,25, 12.25, 5.5), I do not know which linkages are in each state in the final period t+100. I know that 7.25 will be in state s1 after 100 repetition of transition but which linkages are they? Basically, I like to know the specific linkages associated with (7.25, 12.25, 5.5).

Note that these matrices represent two different weighted directed graphs with 5 vertices. Elements of these two matrices are assigned to one of the five states s1=[0, 0.5], s2=(0.5, 1], s3=(1, 1.5] etc.

r1T1=BoolEval[0<= matT1<=0.5]/.{1->s1};
r2T1=BoolEval[0.5<matT1<= 1]/.{1-> s2};
r3T1=BoolEval[1<matT1<=1.5]/.{1 -> s3};
r4T1=BoolEval[1.5<matT1<=2]/.{1 -> s4};
r5T1=BoolEval[2<matT1<=2.5]/.{1 -> s5};
matT1S = r1T1 + r2T1 + r3T1 + r4T1 + r5T1 // MatrixForm

r1T2=BoolEval[0<=matT2<=0.5]/.{1 -> s1};
r2T2=BoolEval[0.5<matT2<=1]/.{1 -> s2};
r3T2=BoolEval[1<matT2<=1.5]/.{1 -> s3};
r4T2=BoolEval[1.5<matT2<=2]/.{1 -> s4};
r5T2=BoolEval[2<matT2<=2.5]/.{1 -> s5};
matT2S = r1T2 + r2T2 + r3T2 + r4T2 + r5T2 // MatrixForm
Clear[n, states, map];
n = Length[matT2S];
states = {s1, s2, s3, s4, s5};
map = {};

Do[
   If[matT1S[[i, j]] == states[[1]] &&  
      matT2S[[i, j]] == states[[2]], 
      AppendTo[map, {i, j}]
     ], {i, n}, {j, n}
  ]  
 
Length[map]   (* gives 0 *)

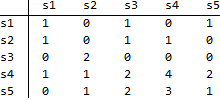
enter image description here

Rows are associated with time t and columns with t+1. This map illustrates that, out of 3 links in state s1 at time t, 1 remains in s1 at t+1, and 1 moves to s3 at t+1 and 1 moves to s5 at t+1. Other numbers in the map should be read likewise. Using this map,

traMap={
         {1,0,1,0,1},
         {1,0,1,1,0},
         {0,2,0,0,0}, 
         {1,1,2,4,2},
         {0,1,2,3,1}
       };
transMatrix=
  DiagonalMatrix[1/Total[traMap,
  {2}]].traMap
transMatrix = {
    {1/3,   0,    1/3,   0,   1/3},
    {1/3,   0,    1/3,  1/3,   0 },
    {0,     1,     0,    0,    0 },
    {1/10, 1/10,  1/5,  2/5,  1/5},
    {0,    1/7,   2/7,  3/7,  1/7}
  };

and

enter image description here

This limiting distribution translates the current vector (3, 3, 2, 10, 7) to (0.17, 0.26, 0.22, 0.23, 0.12)*(3, 3, 2, 10, 7).

My question: Although I found out the transition, I do not know which linkages are in each state in the final period t+100. I like to know the specific linkages associated the new distribution (0.17, 0.26, 0.22, 0.23, 0.12)*(3, 3, 2, 10, 7).

added 2 characters in body
Source Link
Tugrul Temel
  • 6.4k
  • 3
  • 14
  • 33
added 110 characters in body
Source Link
Tugrul Temel
  • 6.4k
  • 3
  • 14
  • 33

Rows are associated with time t and columns with t+1. This map illustrates that, out of 6 links in state s1 at time t, 2 remain in s1 at t+1, and 3 move to s2 at t+1 and 1 moves to s3 at t+1. Other numbers in the map should be read likewise. Using this map, we calculate a

traMap ={{2,3,1},{3,5,2},{2,4,3}};
transMatrix=
  DiagonalMatrix[1/Total[traMap,
  {2}]].traMap

A row-stochastic transition matrix as:

produceswhich is:

Rows are associated with time t and columns with t+1. This map illustrates that, out of 6 links in state s1 at time t, 2 remain in s1 at t+1, and 3 move to s2 at t+1 and 1 moves to s3 at t+1. Other numbers in the map should be read likewise. Using this map, we calculate a row-stochastic transition matrix as:

produces

Rows are associated with time t and columns with t+1. This map illustrates that, out of 6 links in state s1 at time t, 2 remain in s1 at t+1, and 3 move to s2 at t+1 and 1 moves to s3 at t+1. Other numbers in the map should be read likewise. Using this map,

traMap ={{2,3,1},{3,5,2},{2,4,3}};
transMatrix=
  DiagonalMatrix[1/Total[traMap,
  {2}]].traMap

A row-stochastic transition matrix as:

which is:

added 496 characters in body
Source Link
Tugrul Temel
  • 6.4k
  • 3
  • 14
  • 33
Loading
added 380 characters in body
Source Link
Tugrul Temel
  • 6.4k
  • 3
  • 14
  • 33
Loading
added 49 characters in body
Source Link
Tugrul Temel
  • 6.4k
  • 3
  • 14
  • 33
Loading
edited body
Source Link
Tugrul Temel
  • 6.4k
  • 3
  • 14
  • 33
Loading
deleted 1037 characters in body
Source Link
Tugrul Temel
  • 6.4k
  • 3
  • 14
  • 33
Loading
I simplified the question and explained it with an example
Source Link
Tugrul Temel
  • 6.4k
  • 3
  • 14
  • 33
Loading
added 4 characters in body
Source Link
Tugrul Temel
  • 6.4k
  • 3
  • 14
  • 33
Loading
I explained the question to clarify what I want to because the answer was given is not sufficient.
Source Link
Tugrul Temel
  • 6.4k
  • 3
  • 14
  • 33
Loading
Edited into paragraphs.
Source Link
Anton Antonov
  • 38k
  • 3
  • 103
  • 179
Loading
Avoid code block so link actually works
Source Link
Carl Woll
  • 131.7k
  • 6
  • 246
  • 359
Loading
Source Link
Tugrul Temel
  • 6.4k
  • 3
  • 14
  • 33
Loading