3
$\begingroup$

I am trying to take the output from NDSolve and create a variable equal to the solution except for a certain range of values. Here is the code I am trying to use but it does not work. Can anyone suggest why it is not working or what I need to do to fix it? I could have sworn it worked at one point and the just stopped working.

Test = If[0 <= z < ts, BCr[z], Tbl];

The variables ts and Tbl are defined constants. BCr[z] is found using NDSolve all of which are good but the new variable Test will not work. I have tried many different variations of this code and nothing seems to work.

$\endgroup$
6
  • $\begingroup$ Look up Piecewise in the documentation. $\endgroup$
    – MarcoB
    Commented Oct 26, 2015 at 18:34
  • 1
    $\begingroup$ What do you mean by "will not work"? What output do you expect, and what do you actually get? $\endgroup$ Commented Oct 26, 2015 at 18:49
  • $\begingroup$ Your code works for me. If it does not work for you, NDSolve may not be producing an answer. Alternatively, you may have forgotten to define one of your variables. Check for these, correct any errors, restart Mathematica, and run again. By the way, it is not good practice to begin variable names with capital letters. $\endgroup$
    – bbgodfrey
    Commented Oct 26, 2015 at 20:46
  • $\begingroup$ NDSolve is producing an answer and everything else is working properly. The result I want is for Test to be equal the solution of BCr from 0<=z<ts and the rest to be equal to a constant value given by Tbl. When I use this code it evaluates without any errors but when I attempt to plot Test it shows no result. I know I got it to work at one point. I have tried many versions of this code I don't understand whats happening to the value of Test when it runs. $\endgroup$
    – dowlguest
    Commented Oct 26, 2015 at 21:05
  • $\begingroup$ Your code works for me. I believe it would be better in general to define Test[z_]:=... but your code works with no modifications. $\endgroup$ Commented Oct 26, 2015 at 22:22

1 Answer 1

1
$\begingroup$

The assumption is that BCr[z] returns a real number.

I will make some fake data:

BCr[x_] := x
ts = 1;
Tbl = 1;

Now cut and paste your equation

Test = If[0 <= z < ts, BCr[z], Tbl];

and plot it

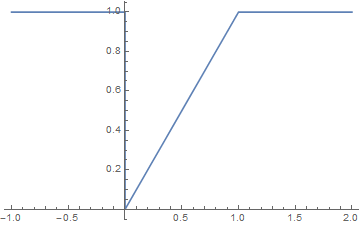
Plot[Test, {z, -1, 2}]

Mathematica graphics

Without changing the result my preference would be to use lower case symbols and make a function out of Test using Piecewise.

bcR[x_] := x
test[x_, ts_, tbl_] := Piecewise[{{bcR[x], 0 <= x < ts }}, tbl]

Now plot it as before (Exclusions-> None includes the discontinuity at zero.

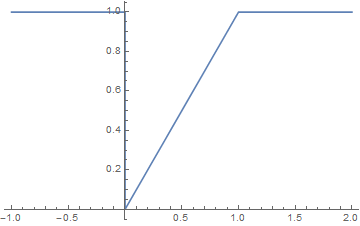
Plot[test[z, 1, 1], {z, -1, 2}, Exclusions -> None]

Mathematica graphics

$\endgroup$

Your Answer

By clicking “Post Your Answer”, you agree to our terms of service and acknowledge you have read our privacy policy.

Not the answer you're looking for? Browse other questions tagged or ask your own question.