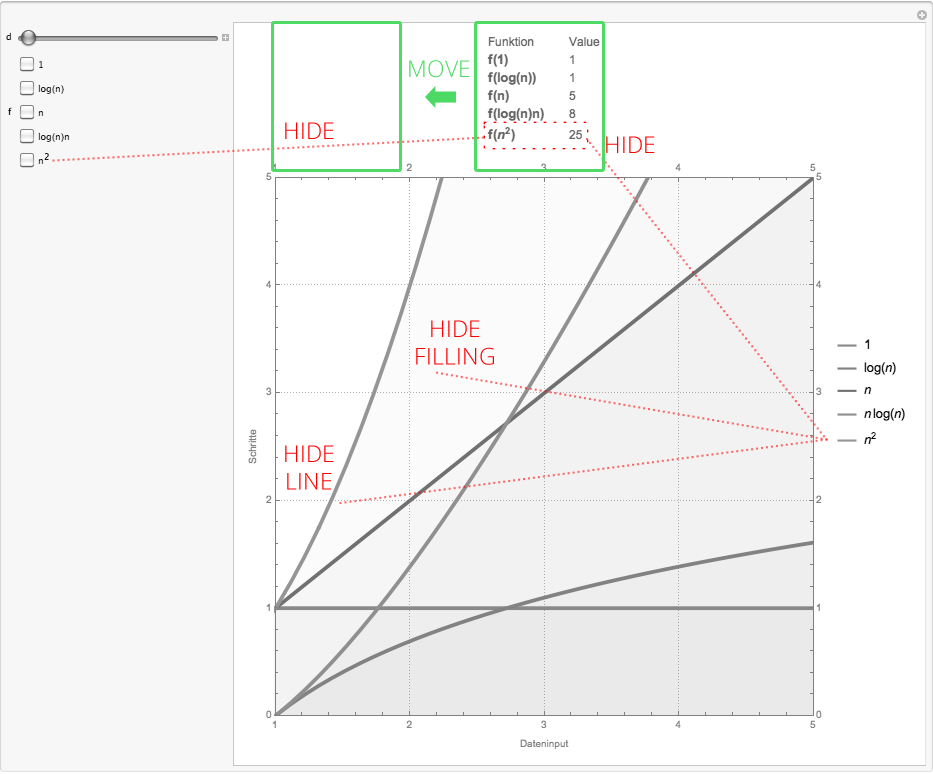
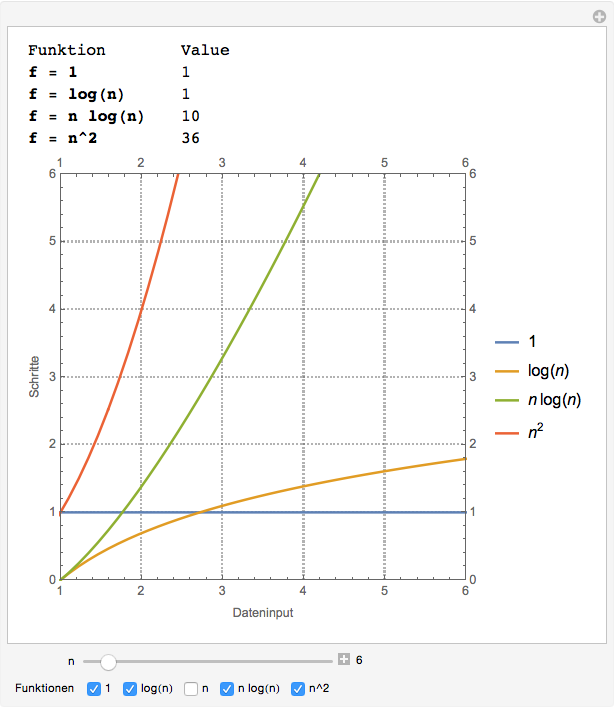
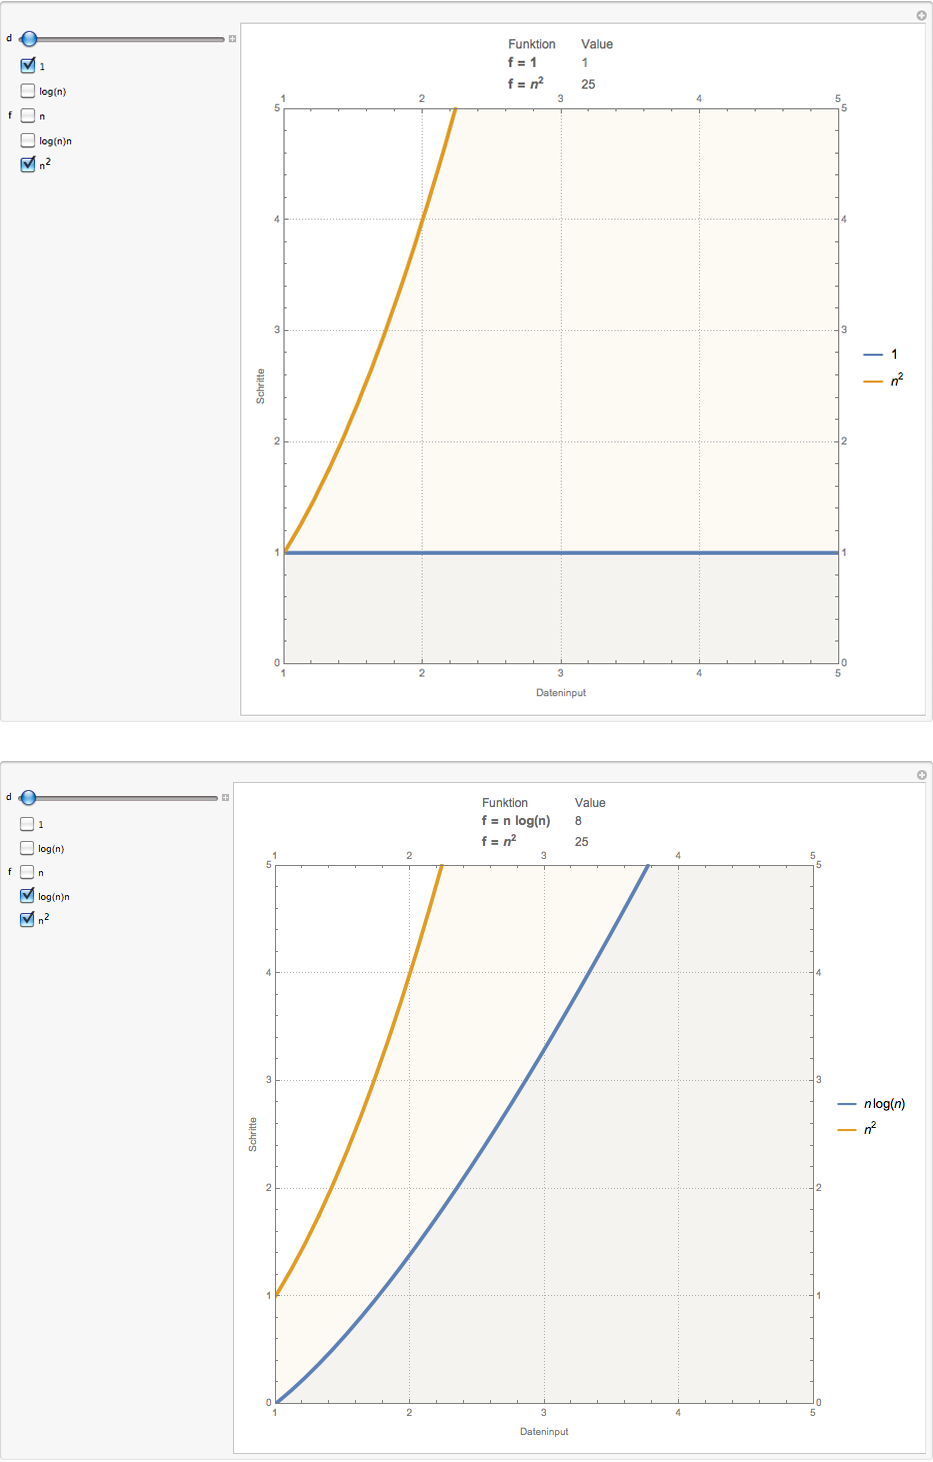
I wanted to change the visibility of a function and its additional informations within a plot through the help of a checkbox, as shown in that post: Toggle visibility of elements in a plot
But currently I don't get it and need some help please. My current code is:
Manipulate[
  Plot[Evaluate[
    f /. {1 -> 1, 2 -> Log[n], 3 -> n, 4 -> Log[n] n, 5 -> n^2}], {n, 0, d},
    PlotLegends -> "Expressions",
    Filling -> Bottom,
    PlotRange -> {{1, d}, {0, d}},
    Background -> White,
    FrameStyle -> Gray,
    FrameLabel -> {Dateninput, Schritte},
    ImageSize -> Large,
    PlotLabel ->
     TableForm[{
       {"Funktion", "Value"},
       {Style[StringForm["f(1)"], 13, Bold], 1},
       {Style[StringForm["f(log(n))"], 13, Bold], Floor[N[Log[d]]]},
       {Style[StringForm["f(n)"], 13, Bold], d},
       {Style[StringForm["f(log(n)n)"], 13, Bold], Floor[N[Log[d] d]]},
       {Style[StringForm["f(n^2)"], 13, Bold], d^2}, {}}],
    FrameTicks -> All,
    PlotStyle -> {Thickness[0.007]},
    AspectRatio -> 1,
    FillingStyle -> {Opacity[0.03]},
    Filling -> None,
    PlotTheme -> "Detailed"],
  {d, 5, 2000, 1},
  {{f, {1, 2, 3, 4, 5}}, {"1", "log(n)", "n", "log(n)n", "n^2"},
    CheckboxBar, Appearance -> "Vertical"},
  ControlPlacement -> Left]
My problems are:
- How can I hide and unhide a function (Line and Filling)?
- How can I hide and unhide the concerning entry within the TableForm ?
- How can I hide and unhide the concerning entry within the PlotLegend ? After the plot-rendering, there are all functions in the PlotLegend at the moment.
- How can I align the PlotLabel to left ?


