13
$\begingroup$

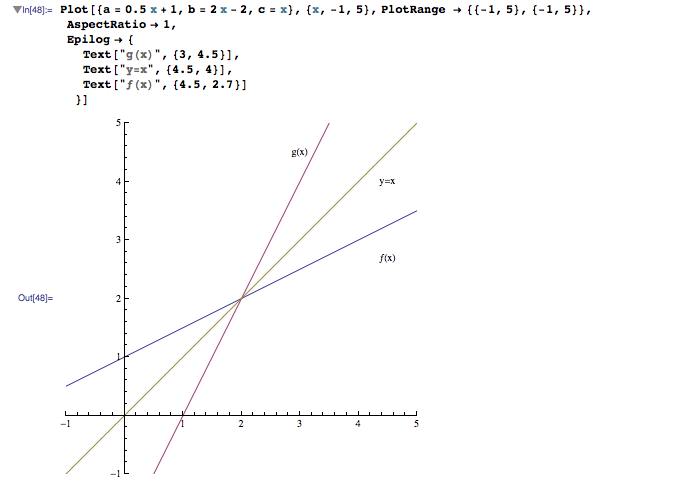
I have three simple graphs in one Plot. Now I am trying to make a button for each graph so you can hide or show it in the plot. Until now I was just able to make a checkbox with the Manipulate function, but I don't now how to tell the checkbox that it should hide my graph when unchecked an display it when checked.

Here is what I was able to make so far, I know it looks simple but I also have many other mathematica documents which at the end just need this button.

enter image description here

$\endgroup$
4
  • $\begingroup$ Welcome to Mathematica.SE! I suggest the following: 1) As you receive help, try to give it too, by answering questions in your area of expertise. 2) Read the FAQs! 3) When you see good Q&A, vote them up by clicking the gray triangles, because the credibility of the system is based on the reputation gained by users sharing their knowledge. ALSO, remember to accept the answer, if any, that solves your problem, by clicking the checkmark sign` $\endgroup$ Commented Sep 25, 2012 at 12:48
  • $\begingroup$ This feels very much like a duplicate question, either here on or StackOverflow, but I cannot find it. $\endgroup$
    – Mr.Wizard
    Commented Sep 26, 2012 at 9:44
  • $\begingroup$ Me neither, thats why I asked the question $\endgroup$
    – elhombre
    Commented Sep 26, 2012 at 10:03
  • $\begingroup$ Thank you to all who answered the question so fast, I am just able to nominate one answer so I selected the one from which I learned the fastest and gave the others a +1 rating. All answers are pretty awesome :D $\endgroup$
    – elhombre
    Commented Sep 26, 2012 at 10:09

3 Answers 3

12
$\begingroup$

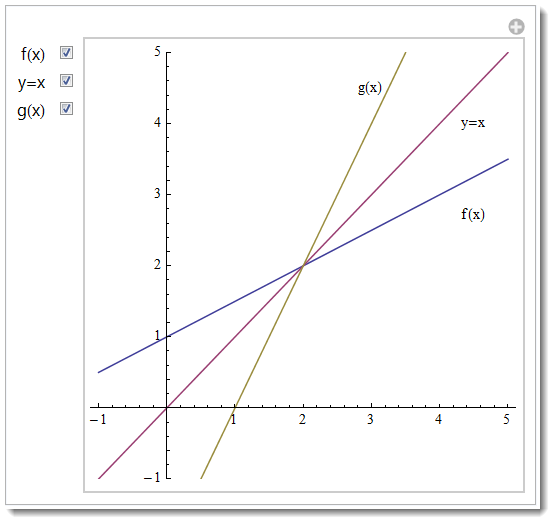
One way to do this is to use Opacity to hide a graph and empty label "" to hide a label:

Manipulate[
 Plot[{0.5 x + 1, x, 2 x - 2}, {x, -1, 5}, 
      PlotRange -> {-1, 5}, AspectRatio -> 1, 
      PlotStyle -> {Opacity[a], Opacity[b], Opacity[c]},
  Epilog -> {
    Text[If[a == 1, "f(x)", ""], {4.5, 2.7}],
    Text[If[b == 1, "y=x", ""], {4.5, 4}],
    Text[If[c == 1, "g(x)", ""], {3, 4.5}]
    }],
 {{a, 1, "f(x)"}, {1, 0}},
 {{b, 1, "y=x"}, {1, 0}},
 {{c, 1, "g(x)"}, {1, 0}}, ControlPlacement -> Left, 
 FrameMargins -> 0]

enter image description here

$\endgroup$
11
$\begingroup$

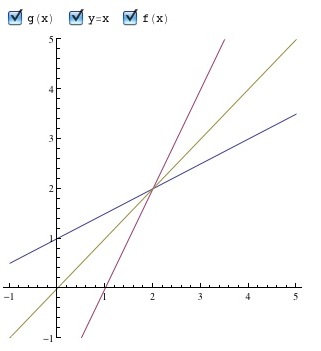
Manipulate is probably the easiest for this specific case but here is an alternative:

 DynamicModule[{select = {1, 2, 3}},

 Column[{
   CheckboxBar[
    Dynamic[select], {1 -> "g(x)", 2 -> "y=x", 
     3 -> "f(x)"}],
   Dynamic@Plot[Evaluate@{0.5 x + 1, 2 x - 2, x}[[select]], {x, -1, 5},
     PlotRange -> {-1, 5},
     AspectRatio -> 1,
     ImageSize -> 300,
     PlotStyle -> ColorData[1, "ColorList"][[select]]
     ]
   }]
 ]

enter image description here

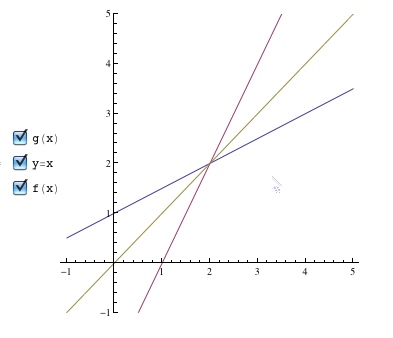
DynamicModule[{select = {1, 2, 3}},

 Row[{
   CheckboxBar[
    Dynamic[select], {1 -> "g(x)", 2 -> "y=x", 3 -> "f(x)"}, 
    Appearance -> "Vertical"],
   Dynamic@Plot[Evaluate@{0.5 x + 1, 2 x - 2, x}[[select]], {x, -1, 5},
     PlotRange -> {-1, 5},
     AspectRatio -> 1,
     ImageSize -> 300,
     PlotStyle -> ColorData[1, "ColorList"][[select]]
     ]
   }]
 ]

enter image description here

$\endgroup$
7
$\begingroup$

As you mentioned that you wanted a GUI using Button

DynamicModule[{b = {True, True, True}, res, 
              funs = {0.5 x + 1, x, 2 x - 2}, pic},
              fun[val_] := If[val == True, "Pressed", "DialogBox"];
              res = Dynamic@
              Row@{Button["f(x)", If[b[[1]] == True, b[[1]] = False, b[[1]] = True],
                   BaseStyle -> {"GenericButton", 20, Bold}, Appearance->fun[b[[1]]]], 
                   Button["y(x)", If[b[[2]] == True, b[[2]] = False, b[[2]] = True],
                   BaseStyle -> {"GenericButton", 20, Bold},Appearance->fun[b[[2]]]], 
                   Button["g(x)", If[b[[3]] == True, b[[3]] = False, b[[3]] = True],
                   BaseStyle -> {"GenericButton", 20, Bold},Appearance->fun[b[[3]]]]
              };
              pic = Column[{res,Dynamic@Plot[
                     Evaluate@Flatten@MapThread[If[#1 == True, #2, Null] &,{b,funs}],
                     {x, -1, 5},PlotRange -> {-1, 5}, AspectRatio ->1,PlotStyle->Thick,
  Epilog -> {Text[If[b[[1]] == True, "f(x)", ""], {4.5, 2.7}], 
    Text[If[b[[2]] == True, "y=x", ""], {4.5, 4}], 
    Text[If[b[[3]] == True, "g(x)", ""], {3, 4.5}]},
  ImageSize -> 500]},
  Alignment -> Center, Frame -> True, Background -> {{LightRed, None}}
  ];
  pic
  ]
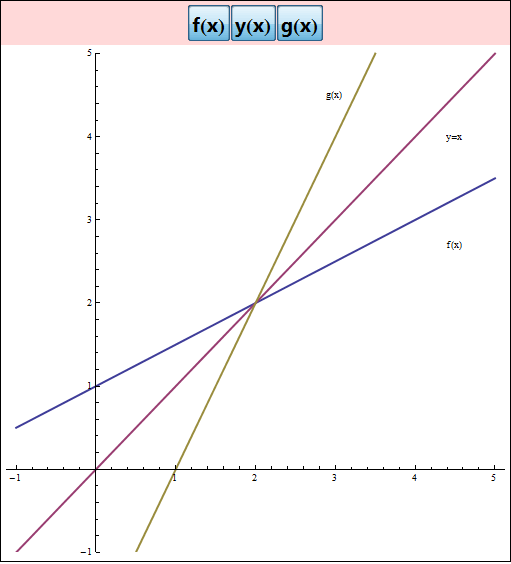
enter image description here

$\endgroup$

Your Answer

By clicking “Post Your Answer”, you agree to our terms of service and acknowledge you have read our privacy policy.

Not the answer you're looking for? Browse other questions tagged or ask your own question.