15
$\begingroup$

Thanks everybody for edit and recommend. Here is a clearer version of my question.

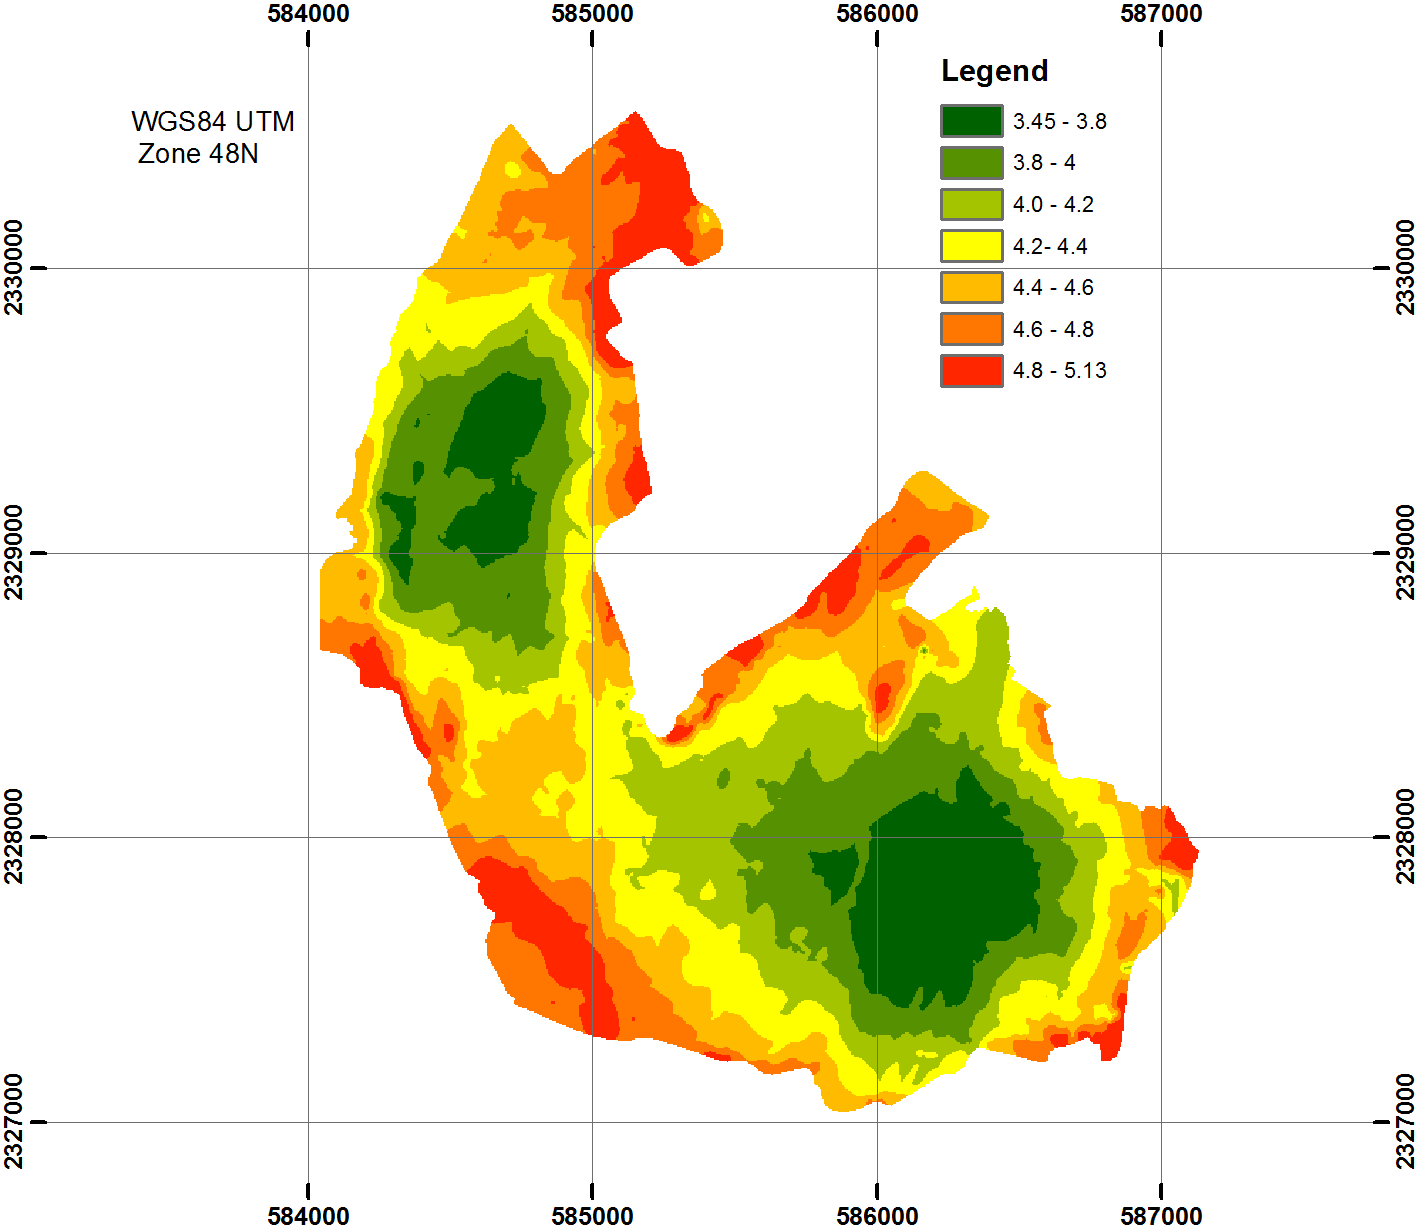
I have a map that shows bathymetry of a lake with legend showing depth relative to a range of color. The map projection is WGS84 UTM Zone 48 North and co-ordinates is available in the map:

bathymetry map

I evaluated

img=Import["https://i.sstatic.net/e4pXK.png"];
PixelValuePositions[img, {1, 0.149, 0}] 

to get a list of pixel positions have the same R G B value (color red) in this map img. However, these pixel positions are determined by row and column not the map co-ordinates. My question is: How to make Mathematica converting these pixel positions to UTM coordinates? So that I can extract bathymetry data from this map.

$\endgroup$
8
  • $\begingroup$ "If this image is a map that is geo-referenced" <-- What does "geo-referenced" mean? Do some images contain metadata that could be used to align them with a map? (I have no experience with this.) $\endgroup$
    – Szabolcs
    Commented Jul 21, 2015 at 10:31
  • 1
    $\begingroup$ I don't see why you can't do it manually: e.g., if the map's image represents an equirectangular projection, just Rescale[] the image coordinate system {{0, w}, {0, h}} to {{-180, 180}, {-90, 90}}. $\endgroup$ Commented Jul 21, 2015 at 10:39
  • 1
    $\begingroup$ It would greatly help if you could provide the image. How is it obtained? What kind of projection is it? $\endgroup$
    – yohbs
    Commented Jul 21, 2015 at 11:18
  • $\begingroup$ Now, any answer to this question will have to remove the legend first… :) more seriously, is this supposed to be an equirectangular projection of the WGS84 ellipsoid? $\endgroup$ Commented Jul 22, 2015 at 8:20
  • 1
    $\begingroup$ oh, sorry, the map projection used is WGS84 UTM Zone 48 North. $\endgroup$
    – backorion
    Commented Jul 22, 2015 at 8:46

2 Answers 2

17
$\begingroup$

I take a screenshot of your image and assign it to the image variable.

In[2]:= ImageDimensions[image]
Out[2]= {1326, 1150}

This computes the positions of the lines in your image:

In[3]:= lines = ImageLines[Binarize[ColorDistance[image, Gray], {0, .4}]]
Out[3]= {{{0., 638.044}, {1326., 638.044}}, {{0., 132.694}, {1326., 132.694}}, {{0., 891.219}, {1326., 891.219}}, {{0., 385.869}, {1326., 385.869}}, {{306.216, 1150.}, {305.29, 0.}}, {{810.64, 1150.}, {811.565, 0.}}, {{1063.74, 1150.}, {1062.81, 0.}}, {{558.465, 1150.}, {559.391, 0.}}}

Now I compute an approximate linear relation between the UTM x coordinate and the xpixel number:

In[4]:= Transpose[{Sort[Mean /@ lines[[{5, 6, 7, 8}, {1, 2}, 1]]], {584000, 585000, 586000,587000}}]
Out[4]= {{305.753, 584000}, {558.928, 585000}, {811.102, 586000}, {1063.28, 587000}}

In[5]:= x[xpixel_] = Fit[%, {1, xpixel}, xpixel]
Out[5]= 582788. + 3.96079 xpixel

Same thing for the y axis:

In[6]:= Transpose[{Sort[Mean /@ lines[[{1, 2, 3, 4}, {1, 2}, 2]]], {2327000, 2328000, 2329000, 2330000}}]
Out[6]= {{132.694, 2327000}, {385.869, 2328000}, {638.044, 2329000}, {891.219, 2330000}}

In[7]:= y[ypixel_] = Fit[%, {1, ypixel}, ypixel]
Out[7]= 2.32647*10^6 + 3.95609 ypixel

Now we can compute the latlon coordinates of the bounding box of your image, using the information provided about projection and datum:

In[8]:= boundingbox = {GeoPosition[GeoGridPosition[{x[0], y[0]}, "UTMZone48", "WGS84"]],GeoPosition[GeoGridPosition[{x[1326], y[1150]}, "UTMZone48", "WGS84"]]}
Out[8]= {GeoPosition[{21.0372, 105.797}, "WGS84"], GeoPosition[{21.0781, 105.848}, "WGS84"]}

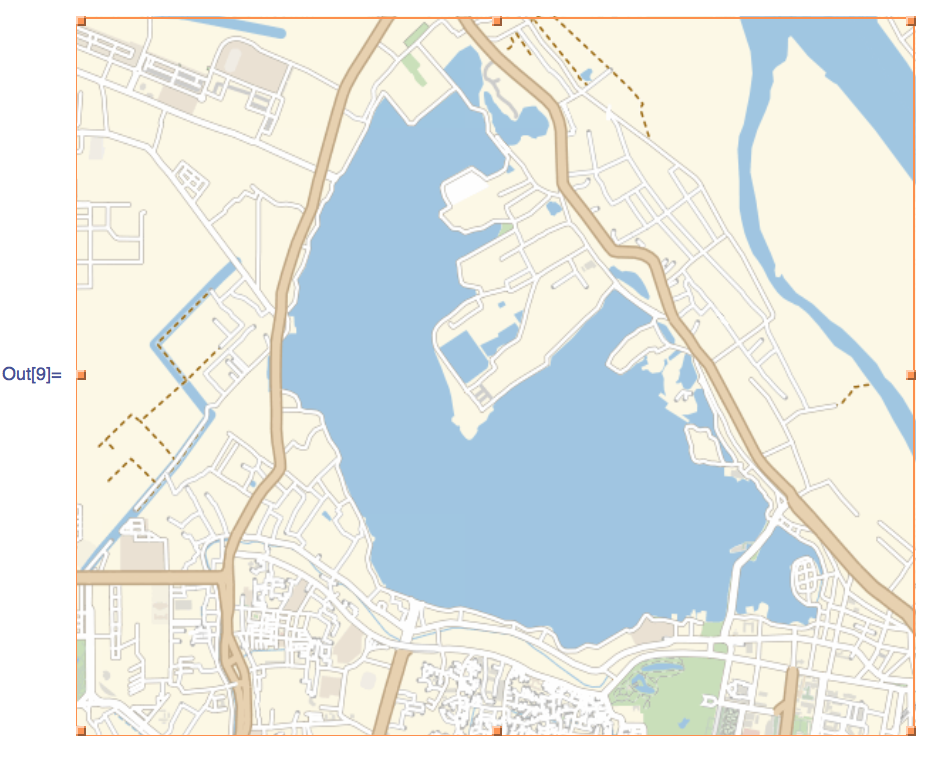
This is the corresponding GeoGraphics call:

In[9]:= GeoGraphics[GeoRange -> boundingbox, GeoProjection -> "UTMZone48"]
enter image description here

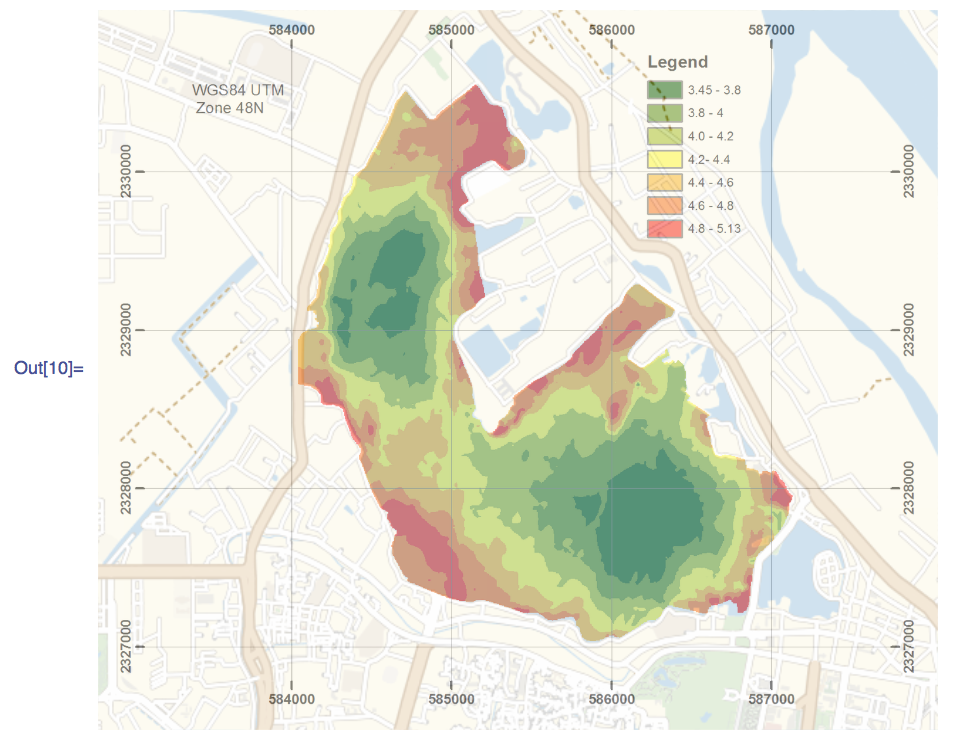
Finally, let me superpose your image on the map:

In[10]:= GeoGraphics[{GeoStyling[{"GeoImage", image}, Opacity[0.5]],  GeoBoundsRegion[boundingbox]}, GeoRange -> boundingbox, GeoProjection -> "UTMZone48"]
enter image description here

$\endgroup$
3
  • $\begingroup$ This is a +10 if I could give it. One question, how would you code this if the image did not have lines? $\endgroup$
    – Bob Brooks
    Commented Jul 23, 2015 at 4:20
  • $\begingroup$ Thank you @jose. I've checked and it works for Mathematica 10. However, Mathematica 9 does not have "ColorDistance" $\endgroup$
    – backorion
    Commented Jul 23, 2015 at 7:50
  • 2
    $\begingroup$ Bob, we need some reference points in the maps to establish a relation between the pixel coordinates and the actual map coordinates (either latlon or some projected coordinates). If there is nothing in the map that can be extracted programmatically with image or graphics tools, then one can always select points manually, for example using the coordinate tools (click on the image or GeoGraphics result and then press the period key). The 8th Application example in the GeoGraphics refpage (about manipulation of an image of Paris) can also give you ideas on how to place an image on a map. $\endgroup$
    – jose
    Commented Jul 23, 2015 at 16:23
6
$\begingroup$

Assuming that there is a linear relation between rows & columns and the UTM coordinates, one could do the following:

Find the rows and columns of the coordinate lines via marginal distributions:

{dimX,dimY} = ImageDimensions[img];

distX = Total[ImageData[ColorConvert[img, "Grayscale"]]]/dimY;

distY = Total[ImageData[ColorConvert[img, "Grayscale"]], {2}]/dimX;

peaksX = FindPeaks[1 - distX, 0, 0.5][[All, 1]];

peaksY = FindPeaks[1 - distY, 0, 0.5][[All, 1]];

Fit linear functions to map rows and columns into corresponding peak positions:

funcX = Evaluate[Fit[Transpose[{peaksX, ticksX}], {1, #}, #]] &;

funcY = Evaluate[Fit[Transpose[{peaksY, ticksY}], {1, #}, #]] &;

Finally, apply the two transformations on the row and column coordinates:

Apply[{funcX[#1], funcY[#2]} &, 
 PixelValuePositions[img, {1, 0.149, 0}], {1}]
$\endgroup$
3
  • $\begingroup$ @Markus van Almsick: could you pls explain a little bit more the line: "funcX = Evaluate[Fit[Transpose[{peaksX, ticksX}], {1, #}, #]] &;" ?What is "ticksX" and "ticksY"? It was not declared before. $\endgroup$
    – backorion
    Commented Jul 23, 2015 at 7:53
  • $\begingroup$ Sorry, I forgot to note the list of tick values taken from the image: $\endgroup$ Commented Apr 11, 2018 at 13:45
  • $\begingroup$ ticksX = {584000, 585000, 586000, 587000}; ticksY = {2327000, 2328000, 2329000, 2330000}; $\endgroup$ Commented Apr 11, 2018 at 13:45

Your Answer

By clicking “Post Your Answer”, you agree to our terms of service and acknowledge you have read our privacy policy.

Not the answer you're looking for? Browse other questions tagged or ask your own question.