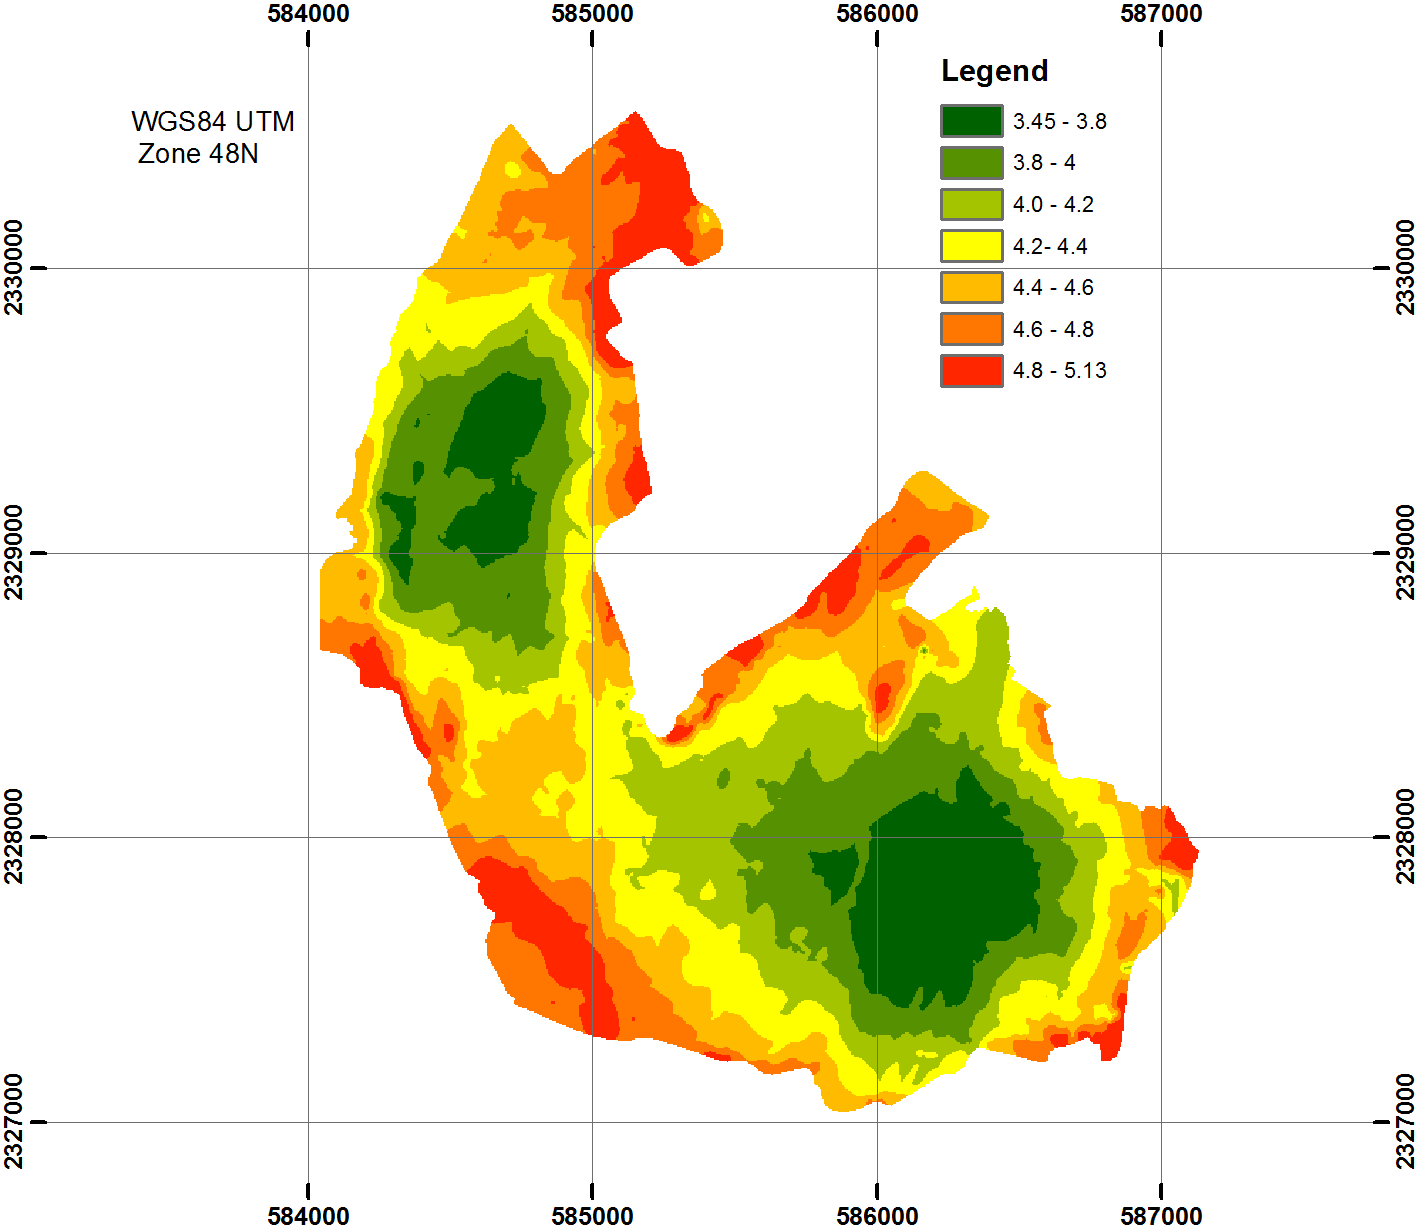
I take a screenshot of your image and assign it to the image variable.
In[2]:= ImageDimensions[image]
Out[2]= {1326, 1150}
This computes the positions of the lines in your image:
In[3]:= lines = ImageLines[Binarize[ColorDistance[image, Gray], {0, .4}]]
Out[3]= {{{0., 638.044}, {1326., 638.044}}, {{0., 132.694}, {1326., 132.694}}, {{0., 891.219}, {1326., 891.219}}, {{0., 385.869}, {1326., 385.869}}, {{306.216, 1150.}, {305.29, 0.}}, {{810.64, 1150.}, {811.565, 0.}}, {{1063.74, 1150.}, {1062.81, 0.}}, {{558.465, 1150.}, {559.391, 0.}}}
Now I compute an approximate linear relation between the UTM x coordinate and the xpixel number:
In[4]:= Transpose[{Sort[Mean /@ lines[[{5, 6, 7, 8}, {1, 2}, 1]]], {584000, 585000, 586000,587000}}]
Out[4]= {{305.753, 584000}, {558.928, 585000}, {811.102, 586000}, {1063.28, 587000}}

In[5]:= x[xpixel_] = Fit[%, {1, xpixel}, xpixel]
Out[5]= 582788. + 3.96079 xpixel
Same thing for the y axis:
In[6]:= Transpose[{Sort[Mean /@ lines[[{1, 2, 3, 4}, {1, 2}, 2]]], {2327000, 2328000, 2329000, 2330000}}]
Out[6]= {{132.694, 2327000}, {385.869, 2328000}, {638.044, 2329000}, {891.219, 2330000}}

In[7]:= y[ypixel_] = Fit[%, {1, ypixel}, ypixel]
Out[7]= 2.32647*10^6 + 3.95609 ypixel
Now we can compute the latlon coordinates of the bounding box of your image, using the information provided about projection and datum:
In[8]:= boundingbox = {GeoPosition[GeoGridPosition[{x[0], y[0]}, "UTMZone48", "WGS84"]],GeoPosition[GeoGridPosition[{x[1326], y[1150]}, "UTMZone48", "WGS84"]]}
Out[8]= {GeoPosition[{21.0372, 105.797}, "WGS84"], GeoPosition[{21.0781, 105.848}, "WGS84"]}
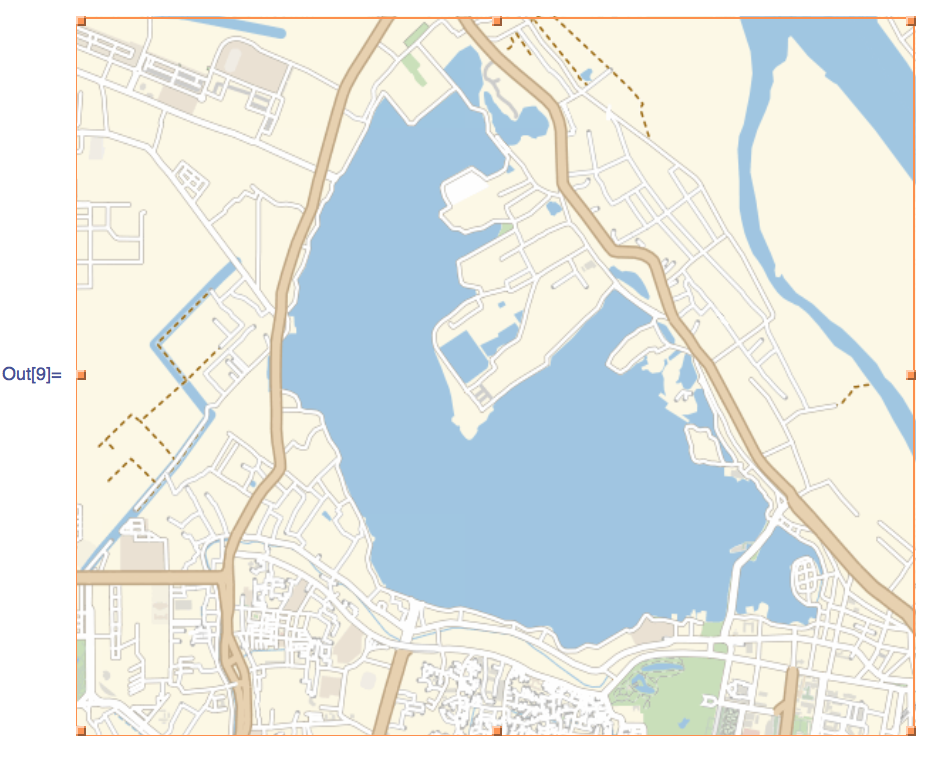
This is the corresponding GeoGraphics call:
In[9]:= GeoGraphics[GeoRange -> boundingbox, GeoProjection -> "UTMZone48"]

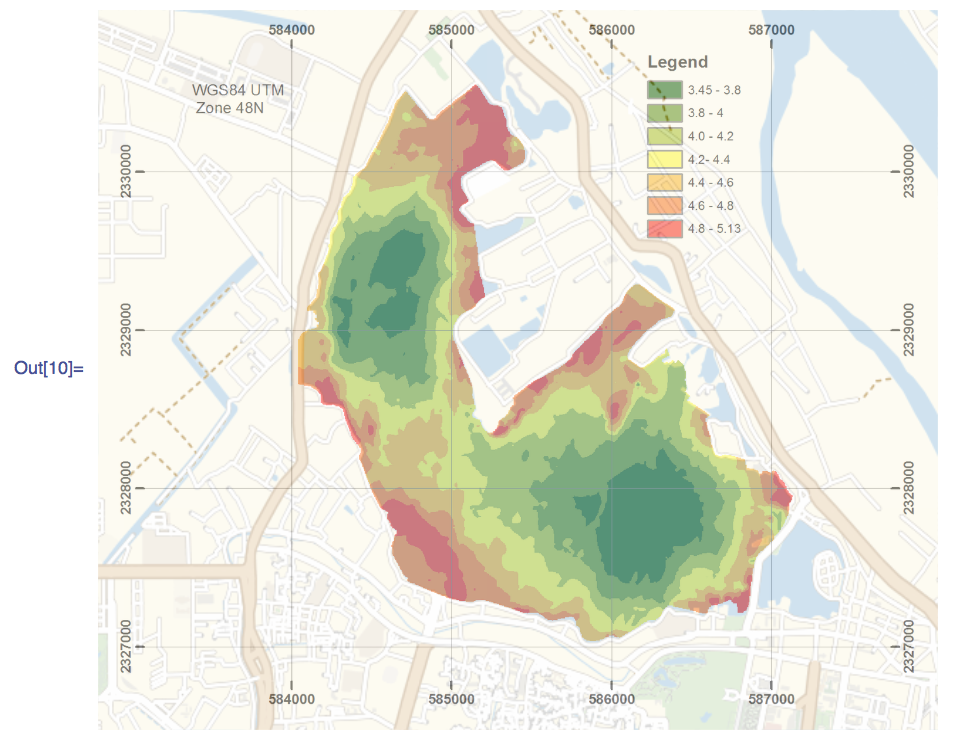
Finally, let me superpose your image on the map:
In[10]:= GeoGraphics[{GeoStyling[{"GeoImage", image}, Opacity[0.5]], GeoBoundsRegion[boundingbox]}, GeoRange -> boundingbox, GeoProjection -> "UTMZone48"]


Rescale[]the image coordinate system{{0, w}, {0, h}}to{{-180, 180}, {-90, 90}}. $\endgroup$