1
$\begingroup$

I want a thin ellipsoid-like figure with an arrow around the ellipsoid. To draw an ellipsoid I used the following code:

 With[{a = 5, c = 1}, 
      ParametricPlot3D[{3 a Cos[u] Sin[v], 2 a Sin[u] Sin[v], 4 c Cos[v]}, 
           {u, 0, 2 π}, {v, -π, π}, Boxed -> False, Axes -> False, Mesh -> None, 
           ColorFunction -> "BlueGreenYellow", ImageSize -> 728]]

This gives me the following output: enter image description here
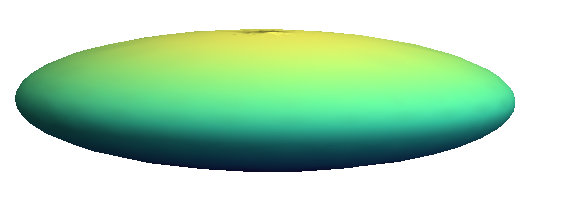
Now, I want to draw arrows that come out from all around (horizontally) this ellipsoid. For example, if the left end is xmin and right end is xmax, I want to draw arrows on the edges of the curve that connects xmin and xmax. So, every arrow is coming from a black dot and it is directed away from it.
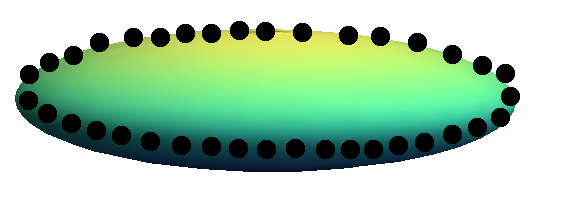
enter image description here

It will be great if anybody can help me with this issue.

$\endgroup$
1

3 Answers 3

3
$\begingroup$
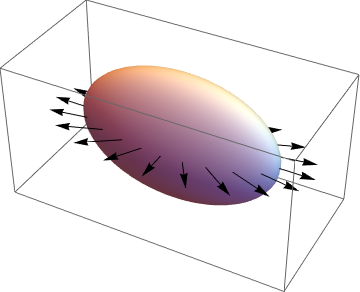
a = Graphics3D[Ellipsoid[{0, 0, 0}, {3, 1, 2}]]

b = Graphics3D[ Arrow /@ Table[{{2 Cos[θ], Sin[θ], 0}, 2 {2 Cos[θ], Sin[θ], 0}}, 
                               {θ, 0, 2 π, π/10}]]

Show[a, b]

enter image description here

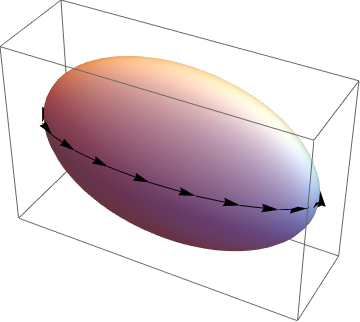
It is unclear whether you'd prefer this:

a = Graphics3D[Ellipsoid[{0, 0, 0}, {3, 1, 2}]];

b = Graphics3D[
   Table[Arrow[{{3.05 Cos[\[Theta]], Sin[\[Theta]], 
       0}, {3.05 Cos[\[Theta] + \[Pi]/10], Sin[\[Theta] + \[Pi]/10], 
       0}}], {\[Theta], 0, 2 \[Pi], \[Pi]/10}]];

Show[a, b]

enter image description here

$\endgroup$
1
$\begingroup$

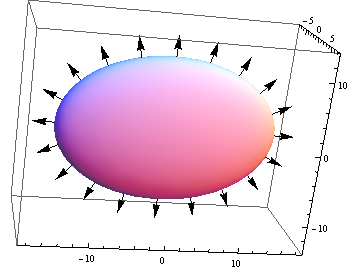
Using the parametric equation and calculating the normal as the cross product of the partial derivatives:

f[u_, v_]      := {3 a Cos[u] Sin[v], 2 a Sin[u] Sin[v], 4 c Cos[v]}
normal[u_, v_] := Evaluate[Normalize@Cross[D[f[x, y], x], D[f[x, y], y]]] /. 
                                                            {x -> u,  y -> v}
Block[{a = 5, c = 1},
 Show[ParametricPlot3D[f[u, v], {u, 0, 2 Pi}, {v, 0, Pi},  PlotRangePadding -> 4],
      Graphics3D[Arrow /@ 
                 Table[{#, # - 3 normal[u, Pi/2]} &@f[u, Pi/2], {u, 0, 2 Pi, 2 Pi/20}]]]

Mathematica graphics

$\endgroup$
0
$\begingroup$

Many thanks for your replies, which helped me a lot. I finally ended up with the following:

a = Graphics3D[{Opacity[.8], EdgeForm[], Cyan, 
    Cylinder[{{0, 0, 0}, {0, 0, 0.1}}, 0.8]}, Boxed -> False, 
   ImageSize -> Large, ViewPoint -> Above];
b = Graphics3D[{Red, 
    Arrow /@ 
     Table[{0.8 {Cos[\[Theta]], Sin[\[Theta]], 0}, { Cos[\[Theta]], 
        Sin[\[Theta]], 0}}, {\[Theta], 0, 2 \[Pi], \[Pi]/15}]}, 
   Boxed -> False, ViewPoint -> Above];
Show[a, b]

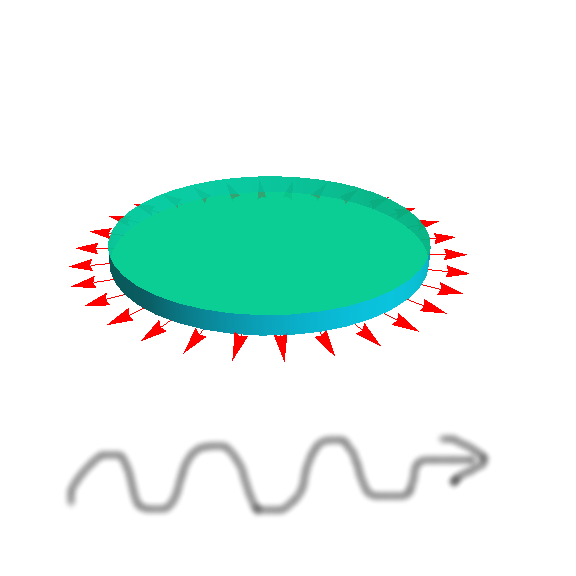
This gives me the output as follows (without the hand-made curved arrow below): enter image description here

I would like to seek another help from you. Is there any way to make these arrows curvy? Instead of plain arrows, is it possible to draw curved arrows shown in the figure. The curve may be similar to the sine curve, for example.

Once again, many thanks in advance.

$\endgroup$
1
  • $\begingroup$ "I would like to seek another help from you" - I suggest asking a new question instead, with maybe a link to this one. $\endgroup$ Commented Jul 14, 2015 at 9:24

Your Answer

By clicking “Post Your Answer”, you agree to our terms of service and acknowledge you have read our privacy policy.

Not the answer you're looking for? Browse other questions tagged or ask your own question.