8
$\begingroup$

In this MSE post, user GeMir noticed that,
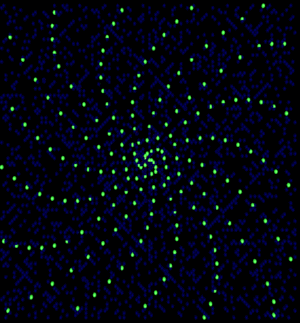
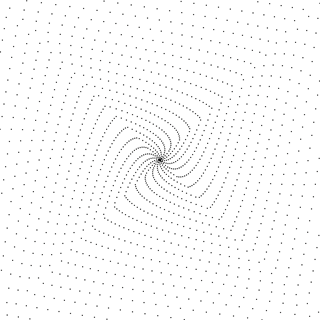
spiral
(source: mathforum.org)

where the green dots are the triangular numbers,

$$T_n = \frac{n(n+1)}{2} = 1,3,6,10,15,21,28,36,45,55,66,78,91,105,120,136,\dots$$

in the Ulam spiral with center $c=1$. If you look closely, the center seems to have a triskelion (a three-curve figure). GeMir says one "arm" (blue numbers below) starts as,

$$T_n = \frac{n(n+1)}{2} = 1,3,\color{brown}{6},\color{blue}{10},15,\color{brown}{21},\color{blue}{28},36,\color{brown}{45},\color{blue}{55},66,\color{brown}{78},\color{blue}{91},105,\color{brown}{120},\color{blue}{136},\dots$$

with a second "arm" (in brown). As pointed out by B. Cipra, the sequences (at least initially) look like oeis.org/A060544 and oeis.org/A081266, respectively.

But that can't be right since the figure apparently has seventeen arms, not just three.

Questions:

  1. It seems the triskelion splits into $17$ arms. Using a Mathematica code, can we "zoom out" and see if the $17$ arms split further into sub-arms? (That is, make a bigger Ulam spiral that ends with a higher bound B than used by GeMir.)
  2. If indeed it stabilizes into just $17$, can we use Mathematica to find a polynomial formula for each arm? (InterpolatingPolynomial[] would do, but one would need the values, and if I make this spiral with pen-and-paper it would be too tedious.)

P.S. The post, Generating an Ulam spiral, contains various codes. However, since my Mathematica coding is very basic, I do not know how to tweak them to answer my questions.

$\endgroup$

3 Answers 3

9
$\begingroup$

Not very efficient, but you may find it useful for some experiments. I perused the code from the link you provided (kuba's), although there are better alternatives in the answers.

ClearAll[spiral, genTri, mp];
spiral[n_?OddQ] := Nest[
   With[{d = Length@#, l = #[[-1, -1]]},
     Composition[
       Insert[#, l + 3 d + 2 + Range[d + 2], -1] &,
       Insert[#\[Transpose], l + 2 d + 1 + Range[d + 1], 1]\[Transpose] &,
       Insert[#, l + d + Range[d + 1, 1, -1], 1] &,
       Insert[#\[Transpose], l + Range[d, 1, -1], -1]\[Transpose] &
       ][#]] &,
   {{1}},
   (n - 1)/2];
genTri[n_] := genTri[n] = IntegerQ[(-1 + Sqrt[1 + 8 #])/2] & /@ Range@n
mp[n_] := mp[n] = Image[Unitize[spiral[n] /.    
                             Thread[Flatten@Position[genTri[n^2], True] -> 0]]]

(* up to 36 10^4 *)
Erosion[mp[601], 1]

Mathematica graphics

There they are, your 17 arms

(* up to 10^6 *)
Erosion[mp[1001], 1]

Mathematica graphics

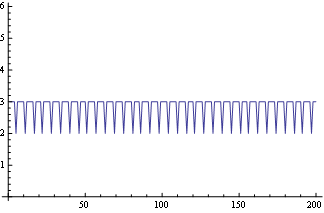
For the "stability" of the number of arms a reasonable condition (rule of dumb thumb) is that the density of triangular numbers remain almost constant in each "layer" of the spiral, so you are not "creating" or destroying arms. And that is what effectively seems to happen:

r[n_] := Range[(2 n + 1)^2 + 1, (2 n + 3)^2]
f[n_] := Count[IntegerQ[(-1 + Sqrt[1 + 8 #])/2] & /@ r[n], True]
ListLinePlot[f /@ Range[200]]

Mathematica graphics

I have no explanation on why the number of arms is 17, though.

$\endgroup$
1
  • $\begingroup$ Thanks, especially for establishing the stability of the 17 arms. I had considered the possibility that maybe they would split further. $\endgroup$ Commented Jul 12, 2015 at 3:29
8
$\begingroup$

Here's another perspective for you.

cf[x_] := 
  ColorData[{"DeepSeaColors", {2, 0}}][Mod[Sqrt[8 x + 1] + 1, 2]];
Graphics[{PointSize[Small], cf[#], Point[ulamCoords[#]]} & /@ 
  Range[1024], Background -> Black]

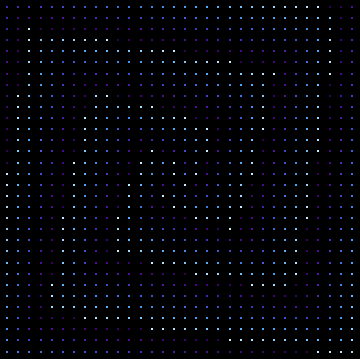
This color function allows us to (visually) trace "triangularity level curves" of a sort, where the brightest points are triangular numbers and other points are colored according to their near-triangularity.

Ulam spiral up to 1024, beginning down then right.

Seen this way, we might insist that a three-armed interpretation is more "natural" and that the seventeen arms are just a convenient artifact. On the other hand -- as you might guess from my username and profile picture -- I am a staunch supporter of the number seventeen in all its appearances and it would be a real shame to deprive it any due glory.

Edit: another picture

Show[
 Graphics[{PointSize[Small], cf[#], Point[ulamCoords[#]]} & /@ Range[10^4]],
 Graphics[{PointSize[Medium], Red, Point[ulamCoords[#]]} & /@ Table[k (k + 1)/2, {k, 1, 140}]],
 Background -> Black]

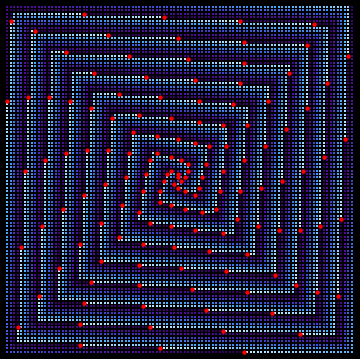
Ulam spiral up to 10^4, beginning down then right.

This one goes up to 10^4, with triangulars overlaid in red.

Edit 2: Full disclosure Here's the implementation I wrote up for number -> Ulam coordinates:

ulamCoords[x_] :=
 With[{s = Ceiling[Sqrt[x]]},
  Piecewise[
   {
    {{-(1/2) (s - 1), s^2 - 1/2 (s - 1) - x}, 
     Mod[s, 2] == 1 && s^2 - s + 1 <= x <= s^2},
    {{s^2 - 3/2 (s - 1) - x, 1/2 (s - 1)}, 
     Mod[s, 2] == 1 && s^2 - 2 (s + 1) <= x <= s^2 - s + 1},
    {{s/2, -(s^2 - 1/2 (s - 2) - x)}, 
     Mod[s, 2] == 0 && 1 - s + s^2 <= x <= s^2},
    {{-(s^2 - 3/2 s + 1 - x), -(s/2)}, 
     Mod[s, 2] == 0 && s^2 - 2 (s + 1) <= x <= s^2 - s + 1}
    }
   ]
  ]

I've added the precise code needed to generate each picture above.

$\endgroup$
5
  • 1
    $\begingroup$ Oh, the second pic is beautiful! I now clearly see what you mean by how the "three-arm" interpretation is more natural, and the appearance of seventeen arms as an artifact. $\endgroup$ Commented Jul 12, 2015 at 3:25
  • $\begingroup$ I just realized something. If we go even higher than $10^4$, can we tweak the coloring so as to give the illusion that there are more than $17$ arms? (It seems one can almost do so with belisarius' second pic.) $\endgroup$ Commented Jul 12, 2015 at 3:42
  • $\begingroup$ Could you please include the full code for your plots? $\endgroup$ Commented Jul 13, 2015 at 7:59
  • $\begingroup$ Done @belisarius. I left out the derivation for my coordinates, but that's math, not Mathematica. It should be independently verifiable; if not I'd be happy to write it up. $\endgroup$ Commented Jul 14, 2015 at 1:49
  • $\begingroup$ Nice, Thanks a lot ! $\endgroup$ Commented Jul 14, 2015 at 1:58
1
$\begingroup$

A slightly different way:

tripixels[n_] := Module[{g, coords, triQ},
  g = PathGraph[Range[n^2]];
  triQ = Function[x, IntegerQ@Sqrt[8 x + 1]];
  coords = VertexCoordinates /. AbsoluteOptions[g, VertexCoordinates];
  Partition[
    Sort[Thread[coords -> Boole[triQ /@ Range[n^2]]]][[All, 2]], n] //
    Transpose]

ArrayPlot[tripixels[1000], DataReversed -> {True, False}, 
 PixelConstrained -> 1]

From there @belisarius's nice Erosian trick can be used to make it look nicer.

$\endgroup$

Your Answer

By clicking “Post Your Answer”, you agree to our terms of service and acknowledge you have read our privacy policy.

Not the answer you're looking for? Browse other questions tagged or ask your own question.