9
$\begingroup$

Consider the following

testadj = RandomVariate[BernoulliDistribution[0.15], {50, 50}];
AdjacencyGraph[testadj, VertexSize -> Large]

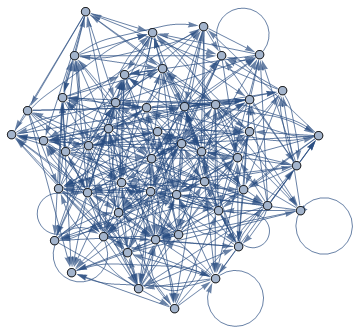
enter image description here

The nodes are almost completely hidden in the mess of edges. They can be made easier to see by making the edges fade into the background a little.

AdjacencyGraph[testadj, EdgeStyle -> Directive[Opacity[0.4], Gray], 
 VertexSize -> Large]

enter image description here

But we still have the problem that the lines draw over the top of the nodes. Is there a way to force the nodes to draw on top of the lines?

$\endgroup$
6
  • $\begingroup$ I have a feeling this has been asked before, or at least came up in a question. I can't find it unfortunately. $\endgroup$
    – Szabolcs
    Commented Jul 26, 2012 at 9:11
  • $\begingroup$ Do you need to keep the graph functionality or would it be enough to create a Graphics (not Graph) object that has the vertices on top? $\endgroup$
    – Szabolcs
    Commented Jul 26, 2012 at 9:12
  • $\begingroup$ @Szabolcs This one? stackoverflow.com/a/8205128/353410 $\endgroup$ Commented Jul 26, 2012 at 12:51
  • $\begingroup$ @belisarius - it's a different problem. $\endgroup$
    – Verbeia
    Commented Jul 27, 2012 at 0:07
  • $\begingroup$ @Verbeia Look at Mr's answer :) $\endgroup$ Commented Jul 27, 2012 at 0:11

4 Answers 4

8
$\begingroup$

Update: In recent versions, vertices render on top. The rendering order can be controlled as follows:

testadj = RandomVariate[BernoulliDistribution[0.15], {50, 50}];
AdjacencyGraph[testadj, VertexSize -> Large, 
   GraphLayout -> {"RenderingOrder" -> #}, 
   ImageSize -> Medium] & /@ {"EdgeFirst", "VertexFirst"}
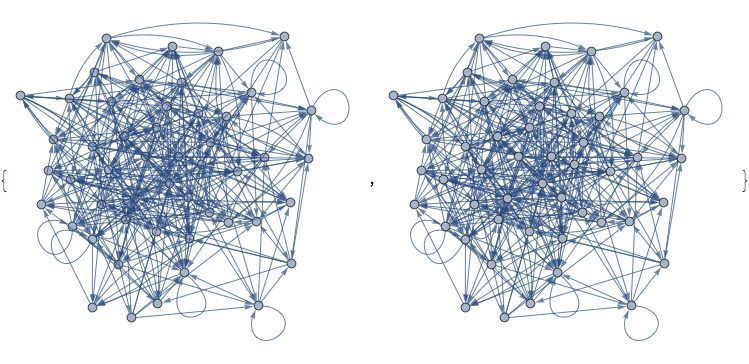
enter image description here


This is a nasty hack. It might be the quickest workaround until you find a solution.

testadj = RandomVariate[BernoulliDistribution[0.15], {50, 50}];
gr = AdjacencyGraph[testadj, VertexSize -> Large]

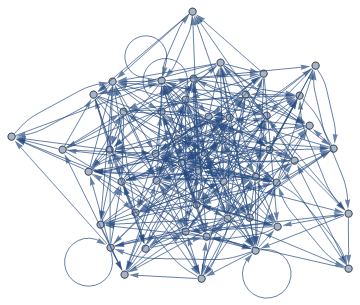
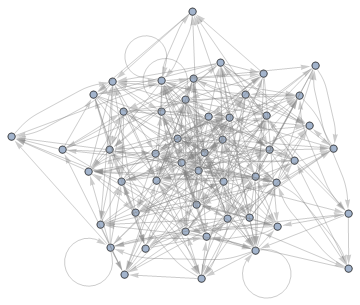
Show[gr, SetProperty[gr, EdgeShapeFunction -> ({} &)]]
Mathematica graphics

The end result is a Graphics object, not a Graph. I am using {} as a "neutral graphics object", something that is accepted inside Graphics, but does not render.

Unfortunately the analogous SetProperty[gr, VertexShapeFunction -> ({} &)] does not seem to work, and I don't understand why. It may have to do something with the fact that the system analyses the vertex shape to make the edges join up nicely to them. If you need to make them disappear, you can use SetProperty[gr, VertexShape -> None].
$\endgroup$
5
$\begingroup$

Here is my implementation by modifying the Box structures.

Clear[vertexFirstShow]
vertexFirstShow[graph_] :=
    Module[{graphdata, vShow},
           graphdata = ToBoxes[graph];
           vShow = 
                  Cases[graphdata, GraphicsGroupBox[{v_, e_}] :> v, \[Infinity]][[1]]
                       /. {
                           TagBox[DiskBox[pos_, r_], "DynamicName", BoxID -> id_]
                                :> DiskBox[DynamicLocation[id], r],
                           TagBox[StyleBox[DiskBox[pos_, r_], opts__], "DynamicName", BoxID -> id_]
                                :> StyleBox[DiskBox[DynamicLocation[id], r], opts]
                          };
           With[{v2 = vShow},
                ToExpression[
                      graphdata /. GraphicsGroupBox[{v_, e_}] :> GraphicsGroupBox[{v, e, v2}]]
          ]]

testadj = RandomVariate[BernoulliDistribution[0.15], {50, 50}];

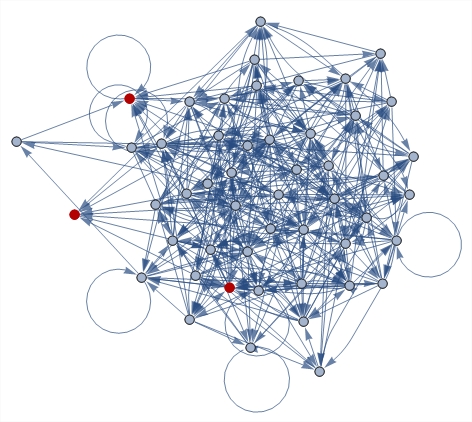
graph = AdjacencyGraph[testadj, VertexSize -> Large, GraphHighlight -> {1, 2, 3}]

vertexFirstShow[graph]

enter image description here

It retains a Graph object, and I'm sure the code can be improved to fit more complicated cases.

$\endgroup$
2
  • $\begingroup$ Really nice solution, thanks! I accepted @Szabolcs' because it was sufficient for our purposes. $\endgroup$
    – Verbeia
    Commented Jul 27, 2012 at 0:07
  • $\begingroup$ @Verbeia His answer is great. It never comes to my mind to use EdgeShapeFunction like that. :) $\endgroup$
    – Silvia
    Commented Jul 27, 2012 at 0:12
4
$\begingroup$

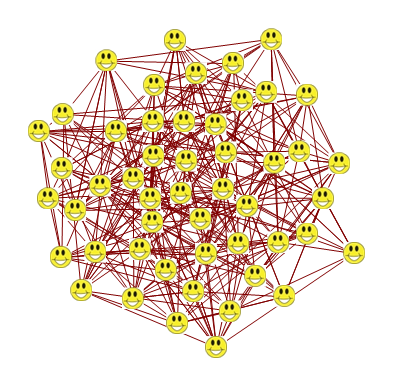
GraphPlot does alright. Perhaps Inset is the key.

testadj = RandomInteger[BernoulliDistribution[0.15], {50, 50}];

(* gr = graphic *)

GraphPlot[testadj, VertexRenderingFunction -> (Inset[gr, #1] &)]

Mathematica graphics

$\endgroup$
3
  • 1
    $\begingroup$ I´d go for the Evolution smiley ;-) $\endgroup$
    – Yves Klett
    Commented Jul 26, 2012 at 9:49
  • $\begingroup$ Having our Q&A in two different sites makes us repeat ourselves :) stackoverflow.com/questions/885910/… $\endgroup$ Commented Jul 26, 2012 at 15:03
  • $\begingroup$ This is a similar solution but the problem is actually different. $\endgroup$
    – Verbeia
    Commented Jul 27, 2012 at 0:07
3
$\begingroup$

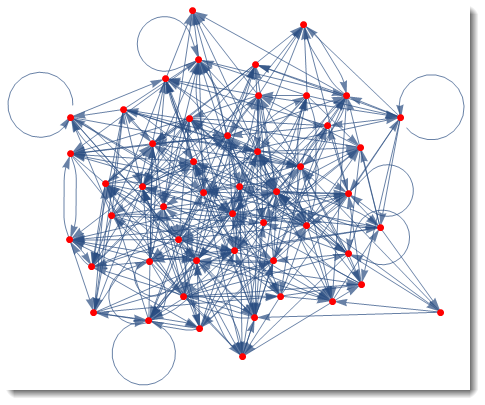
You can always extract full info from Graph and then use graphics primitives. It is more elaborate but it gives full control.

testadj = RandomVariate[BernoulliDistribution[0.15], {50, 50}];
g = AdjacencyGraph[testadj, VertexSize -> 0];
Show[g, Graphics[{Red, PointSize[Large], 
   Point[AbsoluteOptions[g, VertexCoordinates][[2]]]}]]

enter image description here

$\endgroup$

Your Answer

By clicking “Post Your Answer”, you agree to our terms of service and acknowledge you have read our privacy policy.

Not the answer you're looking for? Browse other questions tagged or ask your own question.