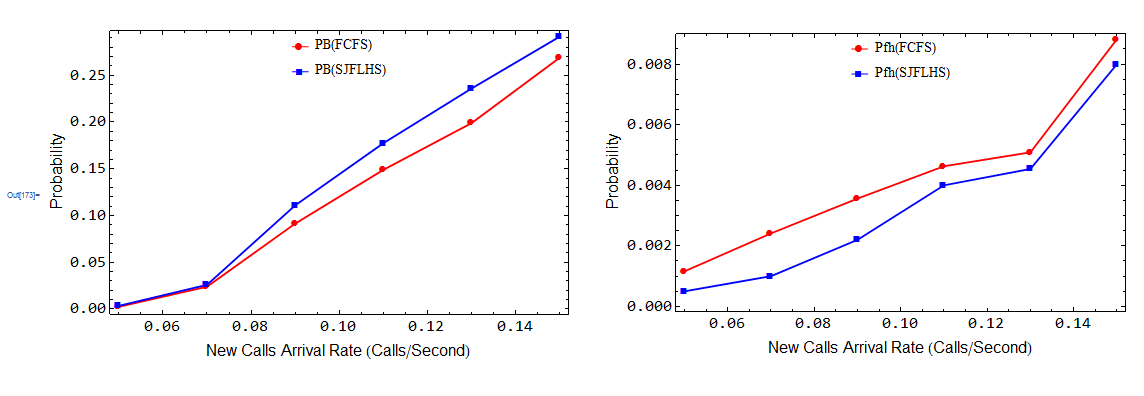
I used the following code
listPB1 = {{0.05, 0.0025}, {0.07, 0.024}, {0.09, 0.0915}, {0.11,
    0.149}, {0.13, 0.199}, {0.15, 0.269}};
listPB2 = {{0.05, 0.0035}, {0.07, 0.026}, {0.09, 0.111}, {0.11,
    0.1775}, {0.13, 0.236}, {0.15, 0.2915}};
listPfh1 = {{0.05, 0.00116}, {0.07, 0.002413}, {0.09,
    0.003561}, {0.11, 0.00463}, {0.13, 0.005089}, {0.15, 0.008824}};
listPfh2 = {{0.05, 0.0005}, {0.07, 0.001}, {0.09, 0.0022}, {0.11,
    0.004}, {0.13, 0.00454}, {0.15, 0.008}};

PB := ListLinePlot[{listPB1, listPB2},
   PlotLegends -> Placed[{"PB(FCFS)", "PB(SJFLHS)"}, {0.5, 0.9}],
   PlotStyle -> {{Red, Thickness[0.004]}, {Blue, Thickness[0.004]}},
   FrameLabel -> {"New Calls Arrival Rate (Calls/Second)",
     "Probability"},
   LabelStyle -> {FontFamily -> "Arial", FontSize -> 18},
   BaseStyle -> {FontFamily -> "Consolas", FontSize -> 15},
   FrameTicksStyle ->
    Directive[FontFamily -> "Consolas", FontSize -> 18],
   PlotMarkers -> {Automatic, 12}, Frame -> True, ImageSize -> 500];
Pfh := ListLinePlot[{listPfh1, listPfh2},
   PlotLegends -> Placed[{"Pfh(FCFS)", "Pfh(SJFLHS)"}, {0.5, 0.9}],
   PlotStyle -> {{Red, Thickness[0.004]}, {Blue, Thickness[0.004]}},
   FrameLabel -> {"New Calls Arrival Rate (Calls/Second)",
     "Probability"},
   LabelStyle -> {FontFamily -> "Arial", FontSize -> 18},
   BaseStyle -> {FontFamily -> "Consolas", FontSize -> 15},
   FrameTicksStyle ->
    Directive[FontFamily -> "Consolas", FontSize -> 18],
   PlotMarkers -> {Automatic, 12}, Frame -> True, ImageSize -> 500];

GraphicsRow[{PB, Pfh}]
and I got the result in the attached picture
I have three questions:
- I want to add the letter "(a)" below the first chart and "(b)" below the second chart, and I don't want to add them manually using the Drawing tools inside Mathematica. Is GraphicsRow the best choice or I should use something else?
- How to use the LegendLayout->Horizontal when the Legend has specific coordinates and not one of these (Top, Below, ...)
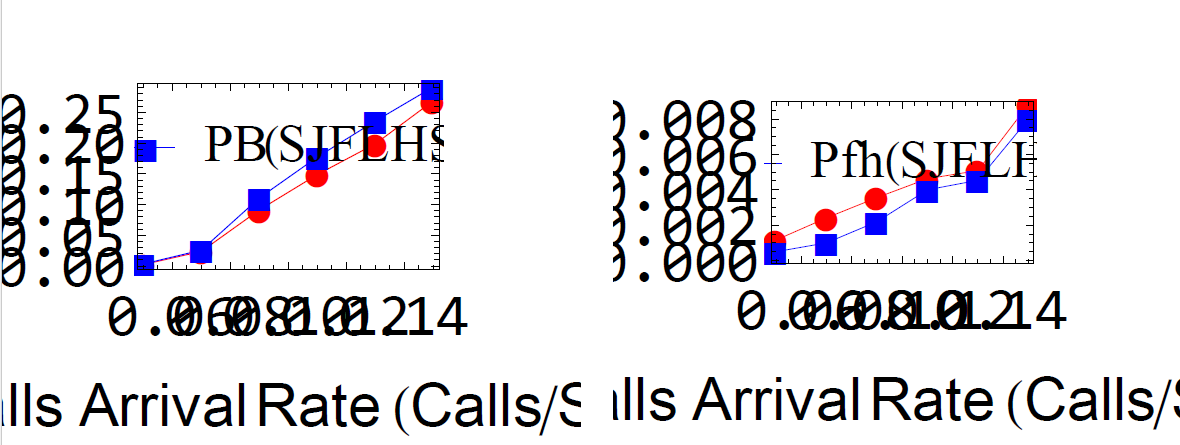
- The chart in the first attached file shows correctly on Mathematica, however when I click select all and save as pdf, it will save like the second attached file. What could be the reason?


GraphicsGridwould work well for you. $\endgroup$