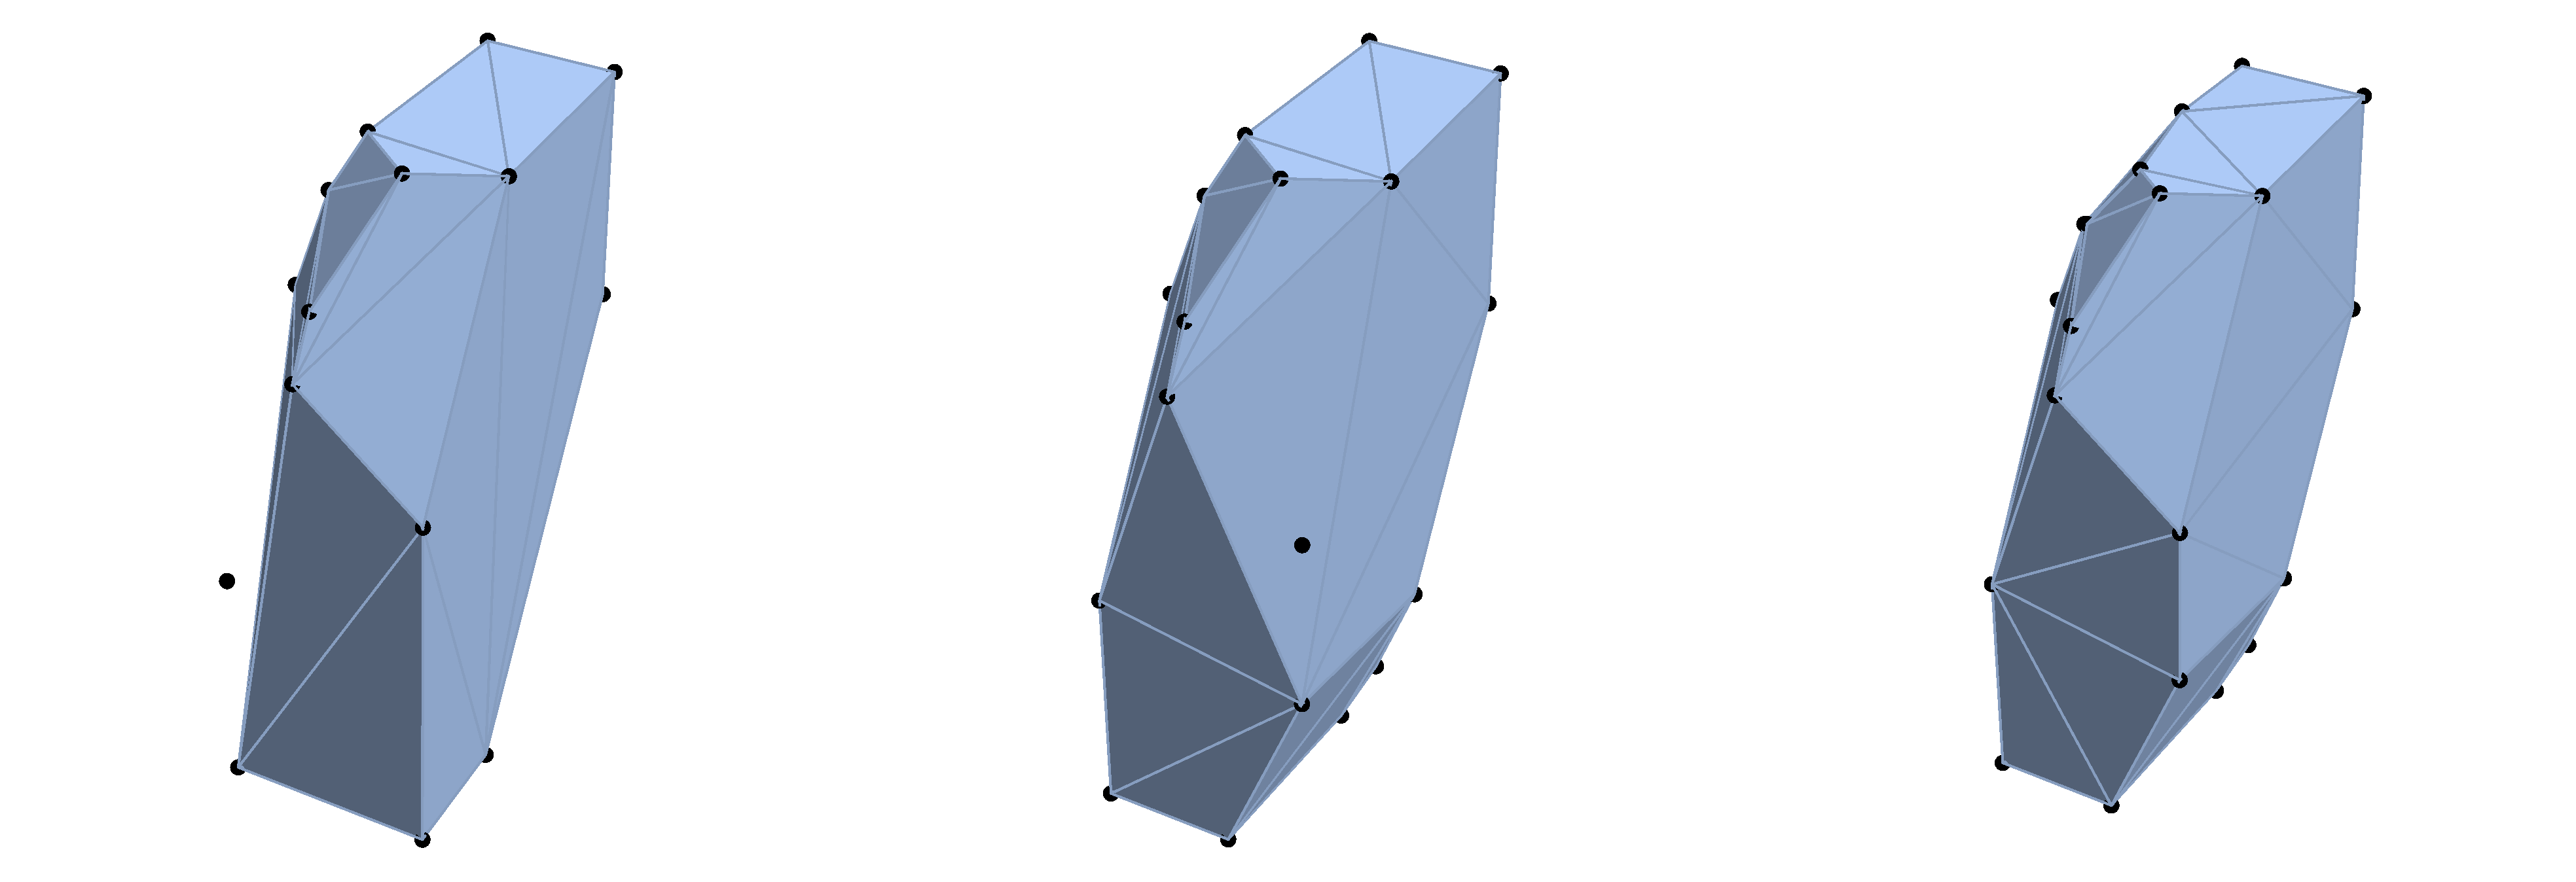
I have a sequence of polytopes that I am trying to visualize, and I find that ConvexHullMesh sometimes excludes points from the convex hull, and it does so inconsistently.
In particular, notice these three convex hulls.

From left to right, the set of points is changing slightly -- a new plane (linear constraint) is added each time, which removes some vertices, but adds new ones as well. However, the convex hull drawn by Mathematica excludes different valid points in the first two plots, and includes them in the last one.
Regardless of how these points are generated, they should all be included in their convex hull (by definition), so this is clearly a bug.
Is anyone familiar with a workaround? Here is a gist of the data.
Edit: This is Mathematica 10.0.2.0 on OSX, and I generate the plots with
PlotPolytope[n_] :=
 Module[
  {
   V = Sort[
     Import["v-" <> ToString[n - 1] <> ".csv"]]
   },
  Show[
   ConvexHullMesh[V[[All, Range[1, 3]]]],
   Graphics3D[{Black, Point[V[[All, Range[1, 3]]]]}]
   ]
  ]

GraphicsGrid[
 {
  {PlotPolytope[8], PlotPolytope[9], PlotPolytope[10]}
  }
 ]
I am only using Sort because it emphasizes the bug. Without it the bug is still visible, but these three particular polytopes are displayed more consistently (but, I emphasize, incorrectly).
