How can I plot the circle $(x-4)^2 +(y-4)^2 = 4$ and two level curves of $f(x,y)=x^3 + y^3 - 3xy$ on Mathematica. I have tried using the ContourPlot command. Can anyone help?
3 Answers
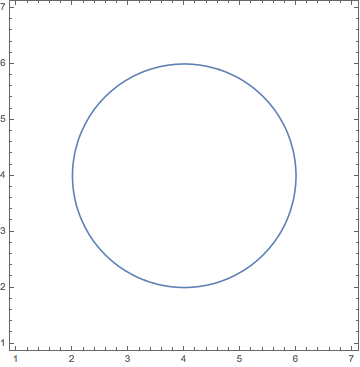
As suggested earlier for the circle, you should use == instead of =. Note the major difference in the meaning between these 2 symbols. = means assignment, i.e., you are defining or setting the LHS to be the RHS. On the other hand == is a logical operator that makes the expression evaluates to True if, and only if the LHS value is the same as the RHS value.
ContourPlot[ (x - 4)^2 + (y - 4)^2 == 4, {x, 1, 7}, {y, 1, 7}]

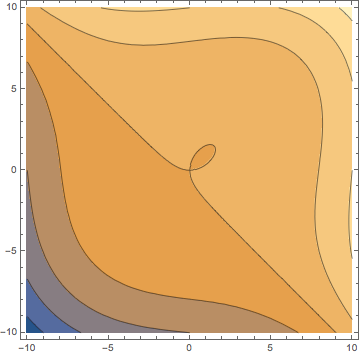
As for the second, just use ContourPlot
ContourPlot[ x^3 + y^3 - 3 x y, {x, -10, 10}, {y, -10, 10}]

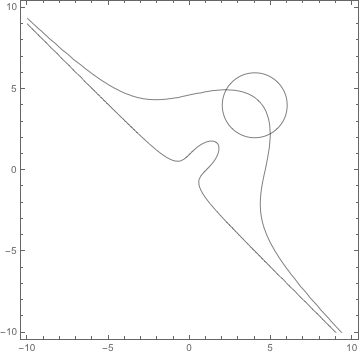
What about
 Show[ContourPlot[x^3 + y^3 - 3 x y, {x, -10, 10}, {y, -10, 10},
      Contours -> {1, 100}, ContourShading -> False],
     ContourPlot[(x - 4)^2 + (y - 4)^2, {x, -10, 10}, {y, -10, 10},
      Contours -> {4}, ContourShading -> False]]

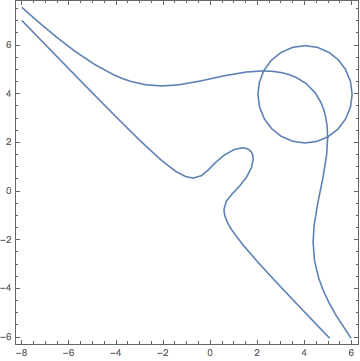
Here's way of creating the plot by using regions.
r1 = ImplicitRegion[(x - 4)^2 + (y - 4)^2 == 4, {x, y}];
r2[k_] := ImplicitRegion[x^3 + y^3 - 3 x y == k, {x, y}];
RegionPlot[RegionUnion[r1, r2[1], r2[100]]]

-
$\begingroup$ Stephen, copying and pasting your source code does not reproduce the figure. Can you revisit your answer ? $\endgroup$– SektorCommented May 19, 2015 at 11:02
-
$\begingroup$ I see you have now fixed the typo. I should really check that my code works AFTER I have finished doing all of my editing ... $\endgroup$ Commented May 19, 2015 at 11:56
-
$\begingroup$ Yes, should have waited more, but I saw you weren't online and decided to do it myself :D .. $\endgroup$– SektorCommented May 19, 2015 at 11:57

==instead of=. $\endgroup$