1
$\begingroup$

I'm new to Mathematica programming, so forgive my rather unsophisticated question.

I need to simulate 5000 "walks" of a process value (of a stock) that starts from its current value, at t0, and ends in T (expiration date of an option). The stocks follow a lognormal process. The process in question must have mean (r - [Sigma]^2/2) and standard deviation ([Sigma] Sqrt[T]). After that, I need to calculate the mean of the 5000 final values that, probably, will correspond to the expected value (E^Q) [Subscript[S, T]]. All of this to find the price of a call option using:

Subscript[C, t] = E^(-r (T - t)) ((E^Q) [Subscript[S, T]] - K)

and find the value in t of my call option.

In theory I know all of this but practically can not do anything. Can someone help me?

$\endgroup$
4
  • 1
    $\begingroup$ If you're interested in doing option pricing I would recommend using the FinancialDerivative function for instance FinancialDerivative[{"European", "Call"}, {"StrikePrice" -> 50.00, "Expiration" -> 1}, {"InterestRate" -> 0.1, "Volatility" -> 0.5, "CurrentPrice" -> 50, "Dividend" -> 0.05}]. I think that will do the full Black-Scholes equation for you and give you better results. $\endgroup$
    – Histograms
    Commented May 15, 2015 at 15:00
  • $\begingroup$ Massimiliano, do you mean (sigma Sqrt[T]) to be the variance or the standard deviation of the underlying normal distribution? I realize that you explicitly say variance, but your usage of sigma seems to be more congruent with a standard deviation instead. $\endgroup$
    – MarcoB
    Commented May 15, 2015 at 15:00
  • $\begingroup$ Also relevant to your problem: (25113); (77400) $\endgroup$
    – MarcoB
    Commented May 15, 2015 at 15:05
  • $\begingroup$ Welcome to Mathematica.SE! I suggest that: 1) You take the introductory Tour now! 2) When you see good questions and answers, vote them up by clicking the gray triangles, because the credibility of the system is based on the reputation gained by users sharing their knowledge. Also, please remember to accept the answer, if any, that solves your problem, by clicking the checkmark sign! 3) As you receive help, try to give it too, by answering questions in your area of expertise. $\endgroup$
    – bbgodfrey
    Commented May 15, 2015 at 15:15

2 Answers 2

1
$\begingroup$

This should generate 5000 samples from the distribution you specified, once you plug in the values of sigma and t:

RandomVariate[
 LogNormalDistribution[r - sigma^2/2, sigma Sqrt[t]],
 5000
]

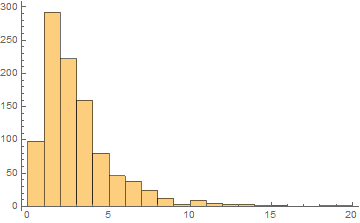
For instance (I just made up numbers here for mean and sigma):

samples = RandomVariate[LogNormalDistribution[1 - 0.5^2/2, 0.5 Sqrt[2]], 1000];
Histogram[samples]

Mathematica graphics

$\endgroup$
5
  • $\begingroup$ The second argument of the LogNormalDistribution is the StandardDeviation of the underlying NormalDistribution not its Variance. $\endgroup$
    – Bob Hanlon
    Commented May 15, 2015 at 14:49
  • $\begingroup$ @BobHanlon Thank you for pointing that out. I realized that I "interpreted" the original user's expression, rather than taking it literally, when he said that variance is ([Sigma] Sqrt[T]): from the way that he used Sigma, it seemed to me that he was referring to it as the standard deviation of the underlying distribution, even though he referred to it as the variance, but let me ask the OP and I'll amend the answer accordingly. $\endgroup$
    – MarcoB
    Commented May 15, 2015 at 14:56
  • $\begingroup$ first of all, thank you so much for the swift response =). Now, I can't use the FinancialDerivate because I have to make a "particular" estimatio changing the probability (from P to Q using the martingale theory). for (sigma Sqrt [T]) I mean standard deviation, excuse for inaccuracy. now last thing, the simulation as I do? I should do 10,000 simulations of a walk of a price, starting from price 32.68 in t0 with and then calculate the average of the final values that, probably, should be the real price. $\endgroup$
    – Madmex
    Commented May 15, 2015 at 15:45
  • $\begingroup$ @MassimilianoPiane I am afraid that I know nothing about finance and related models, but if I were you, I'd rephrase the problem in detail by editing your original question, maybe providing a example as well (even if it's made up). $\endgroup$
    – MarcoB
    Commented May 15, 2015 at 15:55
  • $\begingroup$ ok! thank you anyway =D $\endgroup$
    – Madmex
    Commented May 15, 2015 at 16:19
1
$\begingroup$
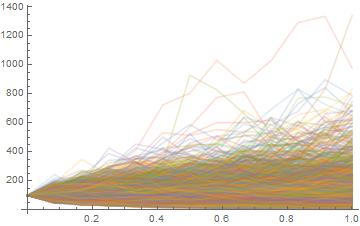
With[{t0 = 0, tend = 1, σ = 0.8, r = .01, S0 = 100, Κ = 110}, 
 data = RandomFunction[GeometricBrownianMotionProcess[0, σ, S0], {t0, tend, 1/12}, 5000];
 Exp[-r (tend - t0)] Mean[Max[#, 0] & /@ (data["LastValues"] - Κ)]]
(* 27.5607 *)

ListLinePlot[data, PlotRange -> All, PlotStyle -> Opacity[0.2]]

Mathematica graphics

Comparing this with Black-Scholes:

d1[s_, x_, r_, t_, σ_] := (Log[s/x] + (r + 1/2 σ^2) t)/(σ Sqrt[t])
d2[s_, x_, r_, t_, σ_] := d1[s, x, r, t, σ] - σ Sqrt[t]
c[s_, x_, r_, t_, σ_] :=  s CDF[NormalDistribution[], d1[s, x, r, t, σ]] - 
   x E^(-r t) CDF[NormalDistribution[], d2[s, x, r, t, σ]]
p[s_, x_, r_, t_, σ_] := x E^(-r t) (1 - CDF[NormalDistribution[], d2[s, x, r, t, σ]]) - 
   s (1 - CDF[NormalDistribution[], d1[s, x, r, t, σ]])

With[{t0 = 0, tend = 1, σ = 0.8, r = .01, S0 = 100, Κ = 110}, 
 data = RandomFunction[GeometricBrownianMotionProcess[0, σ, S0], {t0, tend, 1/12}, 5000];
   c[S0, Κ, r, tend - t0, σ]}]
(* 28.1904 *)

or, with the built-in FinancialDerivative:

With[{t0 = 0, tend = 1, σ = 0.8, r = .01, S0 = 100, Κ = 110},
 FinancialDerivative[{"European", "Call"}, {"StrikePrice" -> Κ, 
   "Expiration" -> 1},  {"InterestRate" -> r, 
   "Volatility" -> σ, "CurrentPrice" -> 100, "Dividend" -> 0}]
 ]
(* 28.1904 *)
$\endgroup$

Your Answer

By clicking “Post Your Answer”, you agree to our terms of service and acknowledge you have read our privacy policy.

Not the answer you're looking for? Browse other questions tagged or ask your own question.