0
$\begingroup$

I want to sample random points between $Cos(x)$ and $Sin(x)$ on $0 \le x\le \frac \pi4$enter image description here
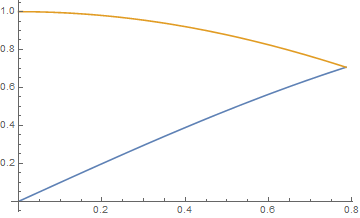
I was able to do graph the function here in Mathematica. I would like to count, and then plot points between those two functions. I have tried the following, however, with no luck.

    counter[n_] := (hitsCount = 0; hitsPoints = {}; 
    Do[{x, y} = {RandomReal[{0, Pi/4}], RandomReal[{0, 1}]}; 
    If[Sin[x] <= y <= Cos[x], 
    hitsCount = hitsCount + 1; 
    hits = AppendTo[hitsPoints, {x, y}]], {i, 1, n}];)
    counter[10000]
    ListPlot[hitsPoints, AspectRatio -> Automatic]

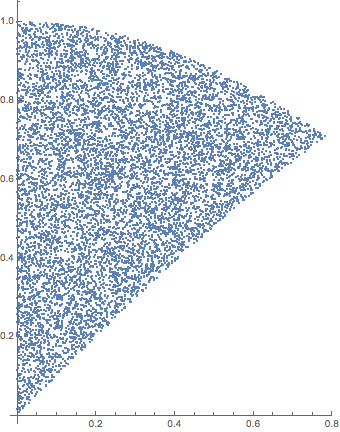
However, instead of a large sample of points of that "pizza" looking shape between Cos(x) and Sin(x), I get a blank plot. Is there an issue with my code?

$\endgroup$
5
  • 1
    $\begingroup$ Apply mathematica.stackexchange.com/questions/57938/… to region = DiscretizeRegion@ImplicitRegion[0 <= x <= Pi/4 && Sin[x] <= y <= Cos[x], {x, y}]. $\endgroup$
    – Michael E2
    Commented Apr 23, 2015 at 18:41
  • $\begingroup$ @MichaelE2 Thank you very much for your help. Is there any way that I could get them to appear as individualized points on my screen instead of what appears to be tiles? Also, could I specify the number of points I need? I need 5000. $\endgroup$
    – user12289
    Commented Apr 23, 2015 at 18:44
  • $\begingroup$ Aha! Yes, that's perfect. Would you mind sharing the syntax? $\endgroup$
    – user12289
    Commented Apr 23, 2015 at 18:47
  • $\begingroup$ Jeez, I forgot I can close plotting questions as duplicate with a single vote. If there are any issues, just let me know. $\endgroup$
    – Michael E2
    Commented Apr 23, 2015 at 18:51
  • $\begingroup$ For what its worth, aside from some stylistic issues the code in the question works fine. $\endgroup$
    – george2079
    Commented Apr 23, 2015 at 19:00

1 Answer 1

2
$\begingroup$

Copying ybeltukov's RegionDistribution from How to generate random points in a region?, we get:

reg = ImplicitRegion[0 <= x <= Pi/4 && Sin[x] <= y <= Cos[x], {x, y}];
region = DiscretizeRegion@reg;
pts = RandomVariate[RegionDistribution[region], 5000]; // AbsoluteTiming
ListPlot[pts, AspectRatio -> Automatic]
(*
  {0.003288, Null}
*)

Mathematica graphics

$\endgroup$
3
  • $\begingroup$ I get the following error: "The specification RegionDistribution is not a random distribution recognized by the system" $\endgroup$
    – user12289
    Commented Apr 23, 2015 at 19:08
  • $\begingroup$ Woops! I forgot a bracket when I copied somewhere. Don't know how I didn't catch the red error message. $\endgroup$
    – user12289
    Commented Apr 23, 2015 at 19:13
  • $\begingroup$ @user12289 I'm glad it works for you. $\endgroup$
    – Michael E2
    Commented Apr 23, 2015 at 19:16

Not the answer you're looking for? Browse other questions tagged or ask your own question.