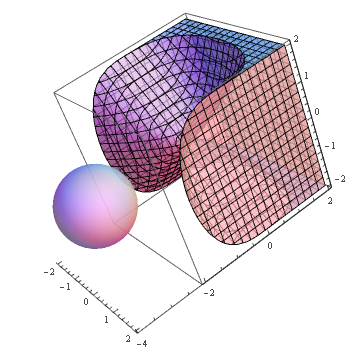
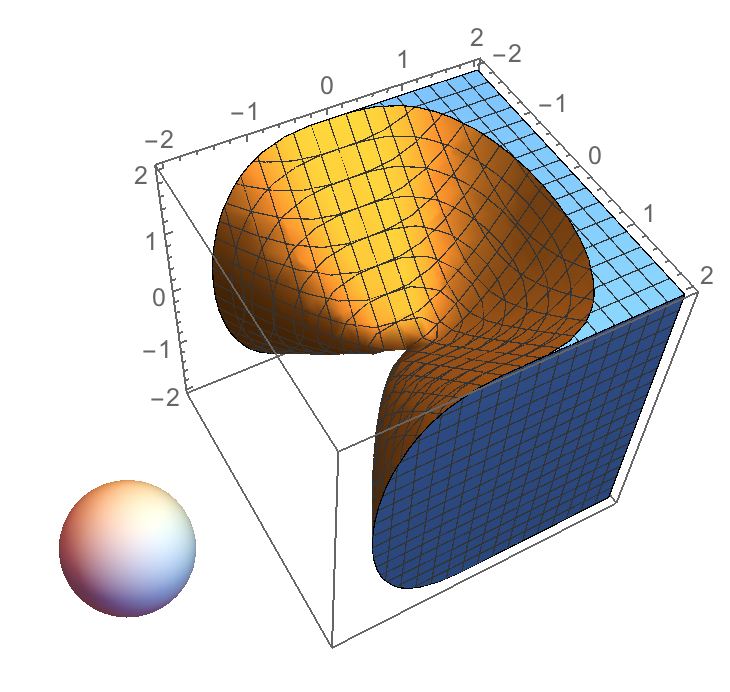
In the following example, I would like to Boxed only the RegionPlot3D, and not the Sphere.
That is, to obtain this:
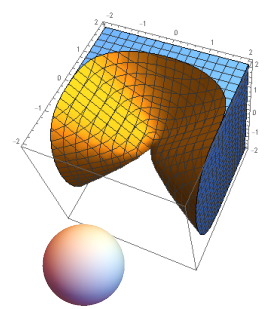
instead of this:
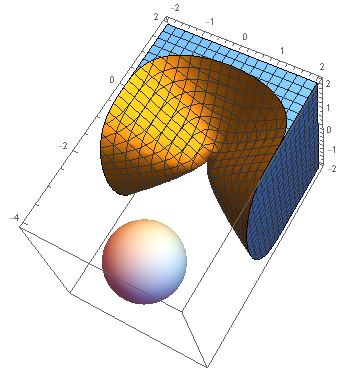
Here's the sample code:
Show[
  RegionPlot3D[x^2 + y^3 - z^2 > 0, {x, -2, 2}, {y, -2, 2}, {z, -2, 2},
    Boxed -> True, Axes -> True, BoxRatios -> Automatic],
  Graphics3D[Sphere[{0, -3, 0}], Boxed -> False, Axes -> False],
    PlotRange -> All]
Obviously, how to do it without a Rasterizeing trick!
Comment: there should really be an easy access to the axes primitives...
EDIT
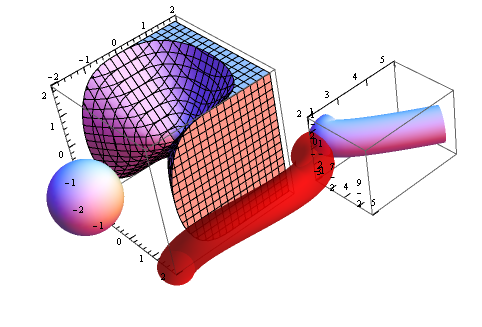
Just to let you know of my real case: I have imported a 3D CAD scene (simple STL always works), with some pipes (industrial kind of thing), and I have field measurements taken from multiple points located at each of the pipes' extremities cross sections. I wanted to join this data, as multiple 3d plots glued to their corresponding pipe extremity (overlap the plot z=0 face with the pipe start/end extremity cross section face), so to easy the data interpretation (orientation in respect to the machine, etc).
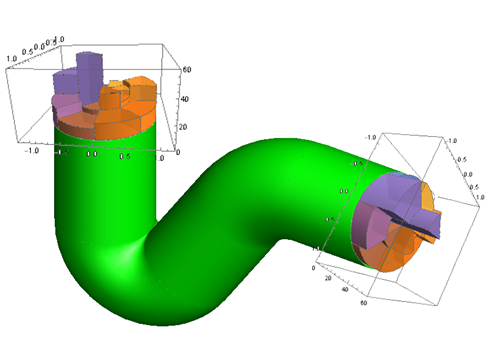
(the above is a mockup image)
(also, sometimes data fits better into a SectorChart3D, sometimes into a a simple Plot3D, etc)
So, the original post example is an extremely simplified version of a real case... where local coordination system's axis are needed, including position, rotation, and scale! (since the measured parameter values might be very different from the physical dimension of the underneath 3D model, or of the other plots in the, which means that they should be independent).
And yet, it shouldn't be too complicated, right?
Wrong! Forgetting the Boxed for a moment, and just thinking at position, rotation and scaling is a nightmare... (for instance, plot scale is defined by box ratios, etc. ... you get the point).
The functions available to create kind of local coordinates systems, to redefine position, rotation an re-scaling of a set of primitives, are not easy to use... (or probably not intended for setting LCS's).
(and most interesting is the fact that this real case would still be complicated to perform in plain 2D...)
EDIT 2
Having played around with the answer from kguler, I can say that it works good enough, although when rotating the plot, it doesn't present the Mathematica automation of the scale position, selecting the axes that is most "visible" (but that sometimes can also be irritating).

