I've seen that it is possible to create a sound from functions:
Sound[{Play[Sin[1000 t (1 + t^2)], {t, 0, .2}],
  Play[Sin[500 t (1 + t^3)], {t, 0, .5}]}]
Is is possible to do the opposite? (to create a function of an input sound)
I've seen that it is possible to create a sound from functions:
Sound[{Play[Sin[1000 t (1 + t^2)], {t, 0, .2}],
Play[Sin[500 t (1 + t^3)], {t, 0, .5}]}]
Is is possible to do the opposite? (to create a function of an input sound)
Given a sounds wave, you can read the samples, and plot part of the sounds wave
fname = "ExampleData/rule30.wav";
ele = Import["ExampleData/rule30.wav", "Elements"]

So the sound file contains the above elements. You can import each on its own.
fs = Import[fname, "SampleRate"]

You can look at first few milliseconds of the sound
 data = Import[fname, "Data"];
 {nChannel, nSamples} = Dimensions[data]

So there is only one channel. This not stero sound wave. Using ListPlot
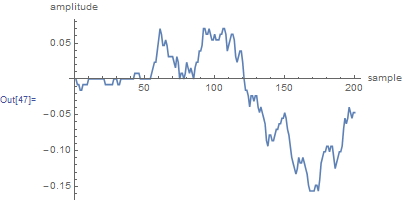
ListLinePlot[data[[1, 1 ;; 200]], AxesLabel -> {"sample", "amplitude"}]

The above is the first 200 samples. Given that there is 44100 samples per second, you can see this is very short amount of time.
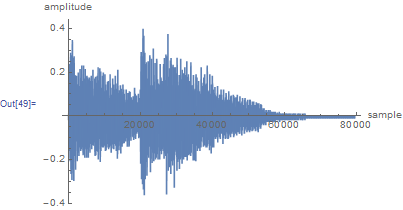
You can try looking at the whole 2 seconds worth of sound
ListLinePlot[data, AxesLabel -> {"sample", "amplitude"}, PlotRange -> All]

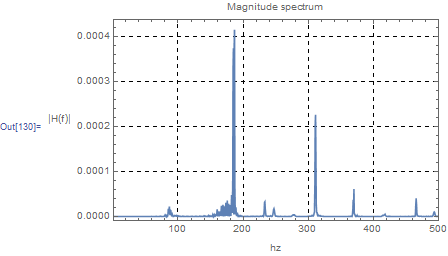
But to obtain a mathematical function to fit this is not easy. You can look at the harmonics in the sounds, and see which ones has most energy by looking at the fft.
py = Fourier[data[[1, All]], FourierParameters -> {1, -1}];
nUniquePts = Ceiling[(nSamples + 1)/2]
py = py[[1 ;; nUniquePts]];
py = Abs[py];
py = py/nSamples;
py = py^2;

If[OddQ[nSamples], py[[2 ;; -1]] = 2*py[[2 ;; -1]],
  py[[2 ;; -2]] = 2*py[[2 ;; -2]]];

f = (Range[0, nUniquePts - 1] fs)/nSamples;
ListPlot[Transpose[{f, py}], Joined -> True,
 FrameLabel -> {{"|H(f)|", None}, {"hz", "Magnitude spectrum"}},
 ImageSize -> 400, Frame -> True, RotateLabel -> False,
 GridLines -> Automatic, GridLinesStyle -> Dashed,
 PlotRange -> {{1, 500}, All}]

So the above says that there is a harmonic of frequency about 200 Hz of which has most energy (largest amplitude), and few others around it.
You can find the bin where this max frequency is using
Max[py]

Position[py, Max[py]]

So this gives an idea of the content. (this sound file must be a sound of something not made by human, the frequency content is too low)