4
$\begingroup$

I'm making a plot of data points from an experiment and the error bars are quite small. I would like the vertical error bars to have wider horizontal lines so that they are easier to see.

Are there any commands I can use to adjust the ErrorBar tick width? I have not been able to find anything on the documentation site and I am relatively new to Mathematica.

Here is my plot from a list of data points:

ErrorListPlot[data, Method -> {"OptimizePlotMarkers" -> False}, 
 PlotMarkers -> "\[FilledSmallCircle]", Joined -> False, 
 PlotRange -> {0.00027, 0.00078}]
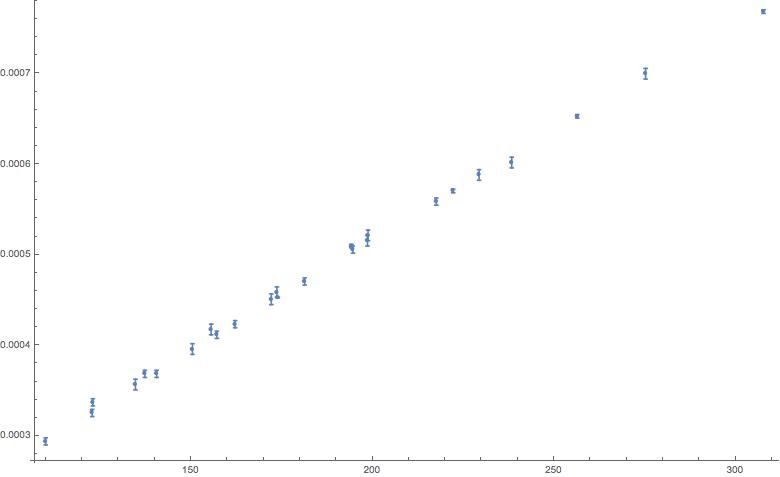
That is what the plot looks like. I know that the error bars are small, but I would like to make the horizontal "ticks" on the top and bottom of the error bars wider.

$\endgroup$
3
  • $\begingroup$ Take a look at the documentation: You can customize what is drawn by your own ErrorBarFunction. $\endgroup$
    – Jinxed
    Commented Mar 21, 2015 at 17:50
  • $\begingroup$ Thank you. I am not sure how to write a function that increases the line width. Do you know of any documentation that I could refer to for this matter? $\endgroup$
    – Mike
    Commented Mar 21, 2015 at 18:01
  • $\begingroup$ Please see my answer for both a solution and a link to relevant documentation. :) $\endgroup$
    – Jinxed
    Commented Mar 21, 2015 at 18:58

1 Answer 1

6
$\begingroup$

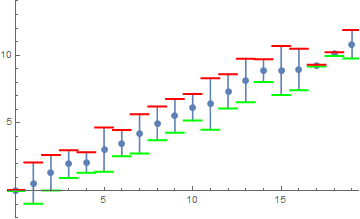
You can use the following construct to draw the error bars yourself using any collection of geometric shapes available:

(* starting out with defining some points, errors etc. *)
pts = NestList[{#[[1]] + 1, #[[2]] + RandomReal[{0., 1.}]} &, {0, 
                RandomReal[]}, 19];
err = RandomReal[4, 20];
data = Table[{pts[[i, 1]], pts[[i, 2]], err[[i]]}, {i, 1, Length@pts}];

hw = 1; (* the width of the ticks *)
ErrorListPlot[data, ErrorBarFunction -> Function[{coords, errs}, {
  (* the vertical line: *)
  Line[{coords - {0, errs[[2, 1]]/2}, coords + {0, errs[[2, 1]]/2}}],
  (* horizontal tick 1: *)
  {Green,Thick,Line[{coords-{hw/2, -errs[[2, 1]]/2}, coords+{hw/2, errs[[2, 1]]/2}}]},
  (* horizontal tick 2: *)
  {Red,Thick,Line[{coords-{hw/2, errs[[2, 1]]/2}, coords+{hw/2, -errs[[2, 1]]/2}}]}
}]]

Example:

hw==1

$\endgroup$
0

Your Answer

By clicking “Post Your Answer”, you agree to our terms of service and acknowledge you have read our privacy policy.

Not the answer you're looking for? Browse other questions tagged or ask your own question.