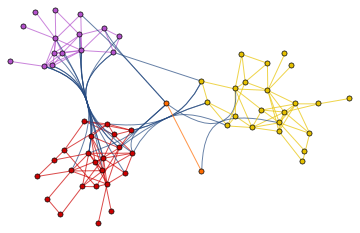
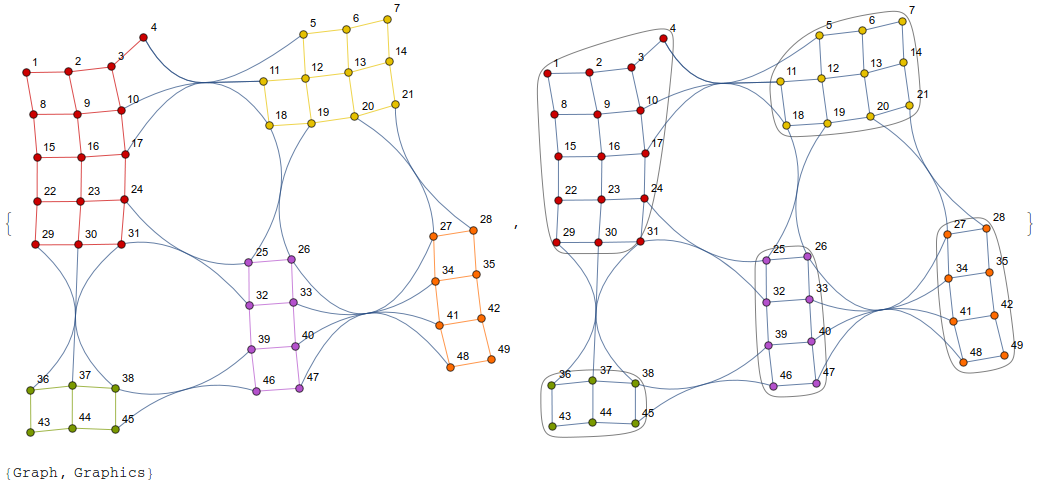
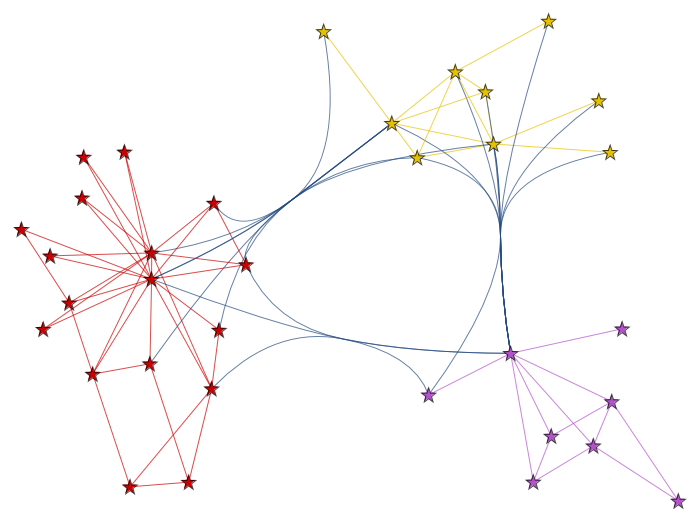
Extracting the Graph object
An alternative way of using Trace to extract the Graph object and vertex coordinates:
ClearAll[communityGraphF]
communityGraphF = ReleaseHold[First[Flatten[Trace[CommunityGraphPlot[#, ##2],
  GraphComputation`GraphDrawing[gr_, vc_, __] :> SetProperty[gr, {vc, Options[#]}],
 TraceInternal -> True]]]] &;
Examples:
zkc = ExampleData[{"NetworkGraph", "ZacharyKarateClub"}];
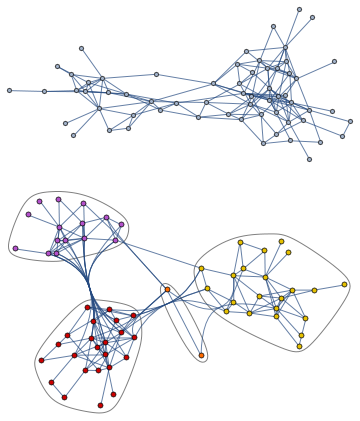
Row[{CommunityGraphPlot[zkc, ImageSize -> 500], communityGraphF[zkc, ImageSize -> 500]}]
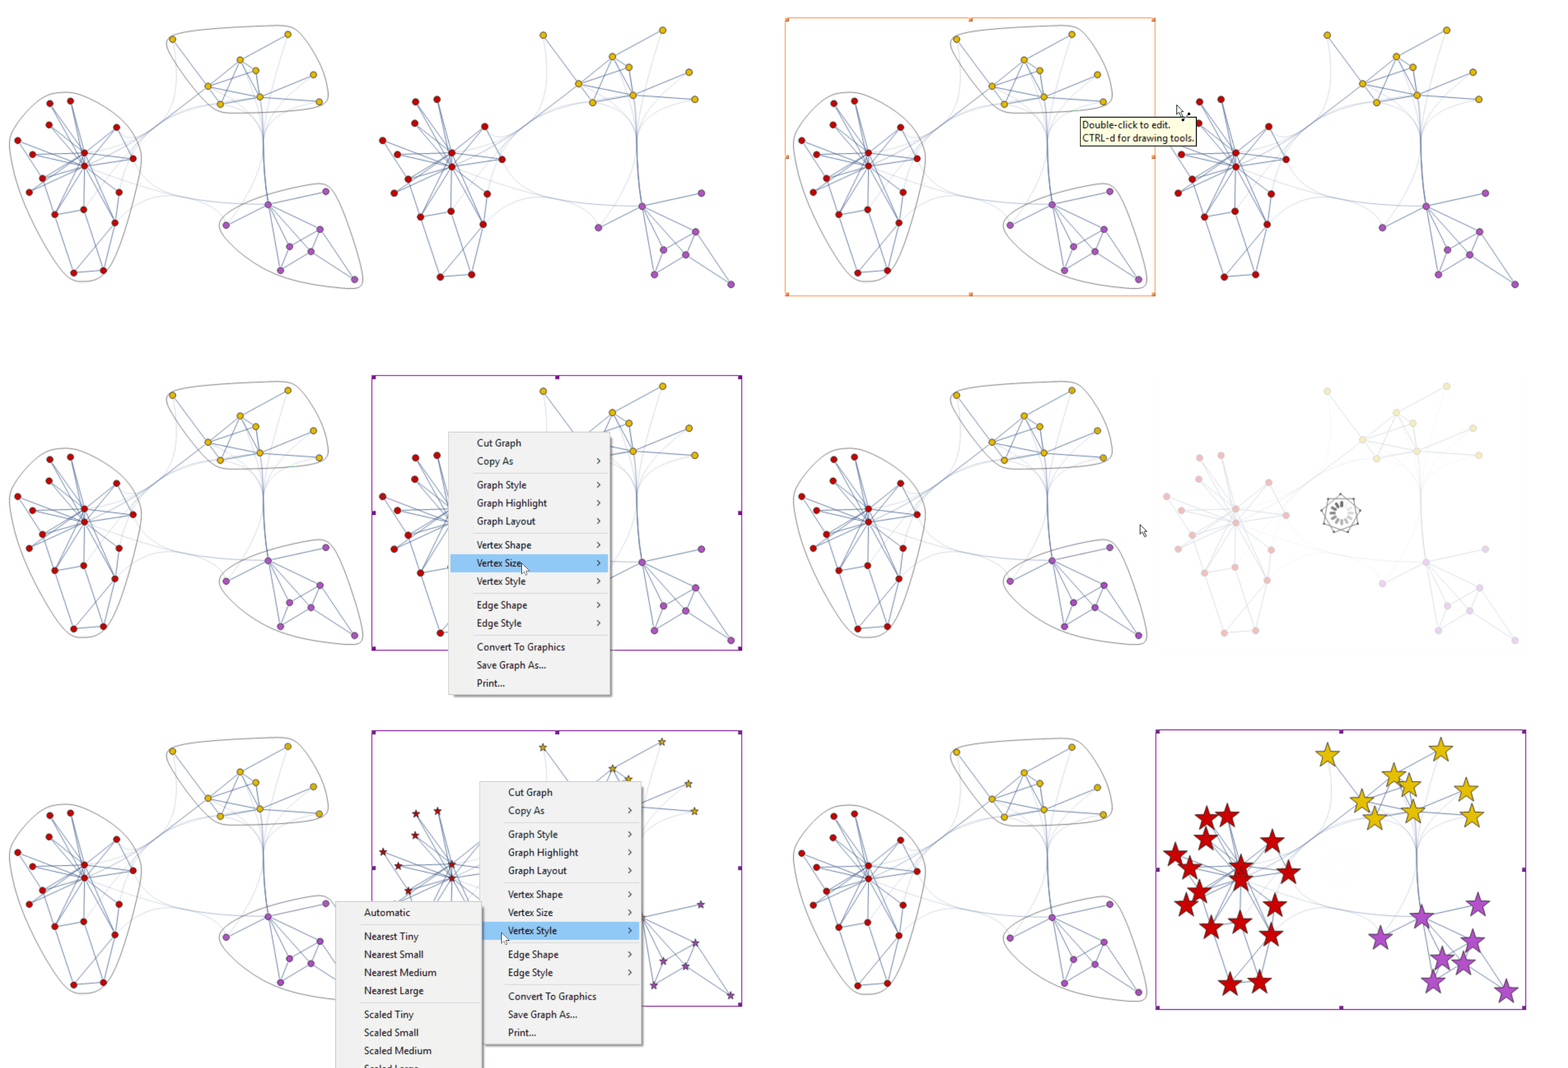
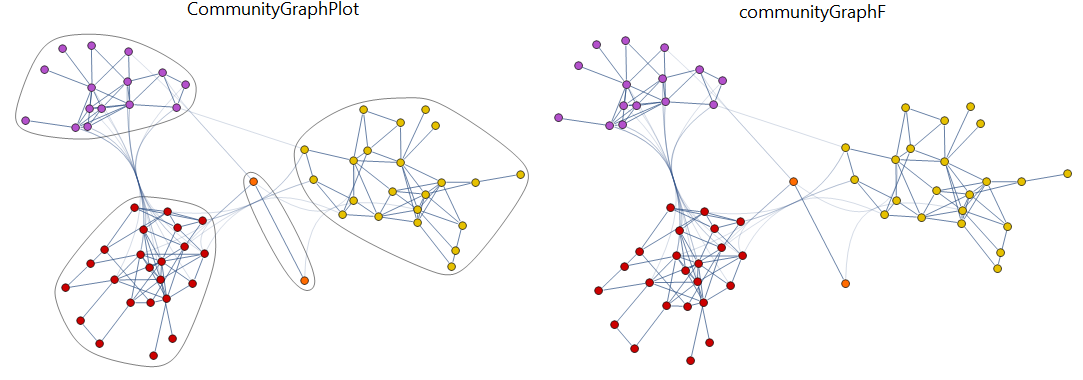
dsn = ExampleData[{"NetworkGraph", "DolphinSocialNetwork"}];
Row[Labeled[ReleaseHold[#[dsn, ImageSize -> 600]], Style[#, 20, "Panel"], Top] & /@
 {HoldForm[CommunityGraphPlot], HoldForm[communityGraphF]}]
Highlighting within-community edges
ClearAll[communityGraphF2, eS]
eS[g_] := Module[{ghS = PropertyValue[{g, #}, GraphHighlightStyle] &},
  If[SameQ[ghS[#], ghS[#2]], VertexStyle /. ghS[#], Gray]] &;

communityGraphF2 = ReleaseHold[First[Flatten[Trace[CommunityGraphPlot[#, ##2],
  GraphComputation`GraphDrawing[gr_, vc_, __] :> SetProperty[gr, {vc, Options[#],
   EdgeStyle -> {UndirectedEdge[u_, v_] :> eS[gr][u, v]}}], TraceInternal -> True]]]] &;
Examples:
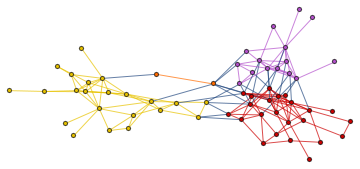
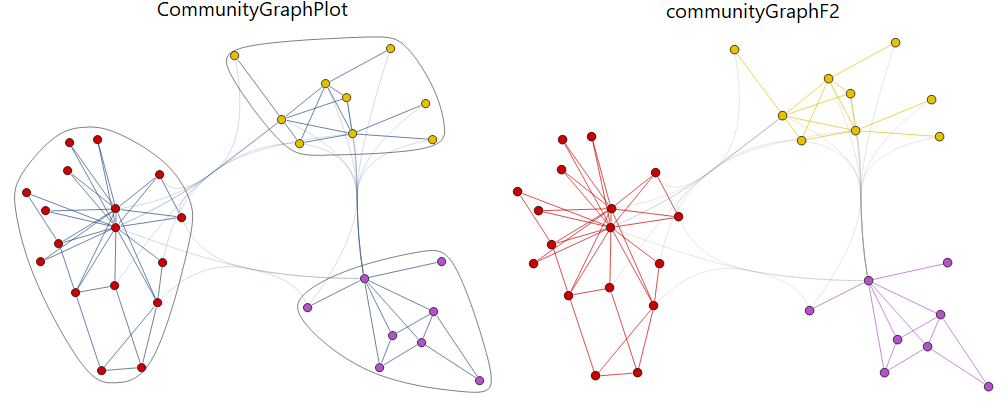
Row[Labeled[ReleaseHold[#[zkc, ImageSize -> 500]], Style[#, 20, "Panel"], Top] & /@
 {HoldForm[CommunityGraphPlot], HoldForm[communityGraphF2]}]
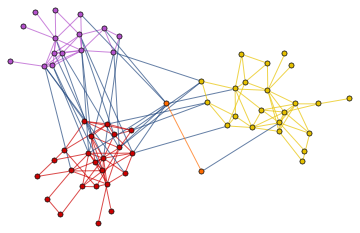
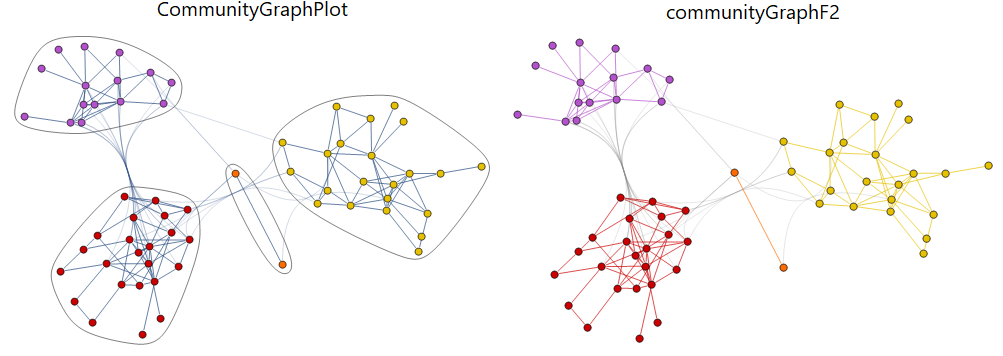
Row[Labeled[ReleaseHold[#[dsn, ImageSize -> 500]], Style[#, 20, "Panel"], Top] & /@
 {HoldForm[CommunityGraphPlot], HoldForm[communityGraphF2]}]
Extracting the blobs and the labels
To get the blobs and labels we need a few more lines:
communityGraphFwBlobs = Module[{blobsandlabels =
   DeleteDuplicates[ReleaseHold[Flatten@Trace[CommunityGraphPlot[##],
    _[GraphComputation`GraphCommunitiesPlotDump`blobsgraphics |
      GraphComputation`GraphCommunitiesPlotDump`labelgraphics, b_] :> b,
   TraceInternal -> True]] /. {{} -> Sequence[], Graphics[x_, ___] :> x }]},
  ReleaseHold[First[Flatten[Trace[CommunityGraphPlot[#, ##2],
    GraphComputation`GraphDrawing[gr_, vc_, __] :>
     SetProperty[gr, {vc, Options[#], Prolog -> blobsandlabels}],
   TraceInternal -> True]]]]] &;
Examples:
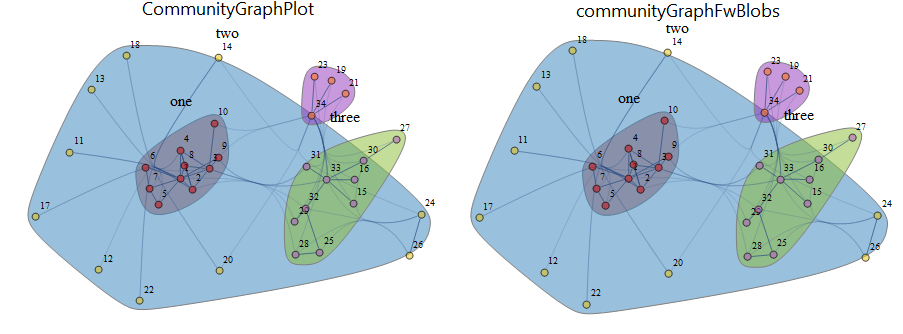
opts = Sequence[VertexLabels -> "Name", CommunityRegionStyle -> 63,
   CommunityLabels -> (Style[#, 18] & /@ {"one", "two", "three"}),
   BaseStyle -> FaceForm[Opacity[.5]], ImagePadding -> 15, ImageSize -> 500];


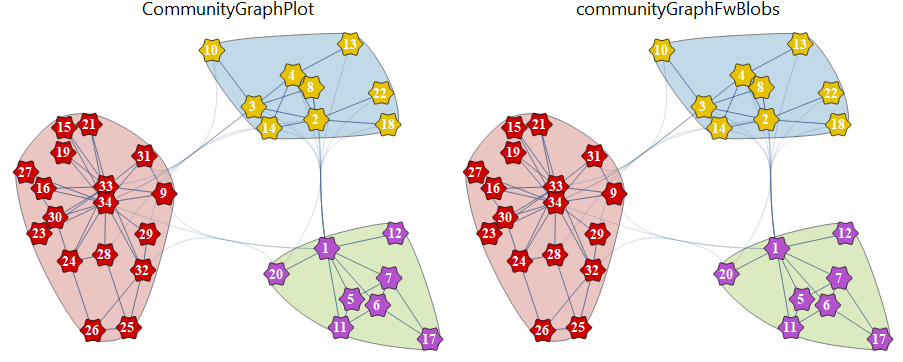
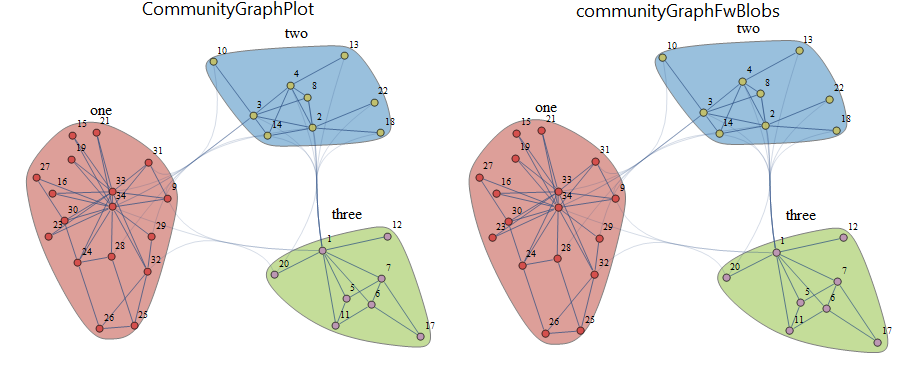
Row[Labeled[ReleaseHold@#[zkc, opts], Style[#, 20, "Panel"], Top] & /@
  {HoldForm[CommunityGraphPlot], HoldForm[communityGraphFwBlobs]}]
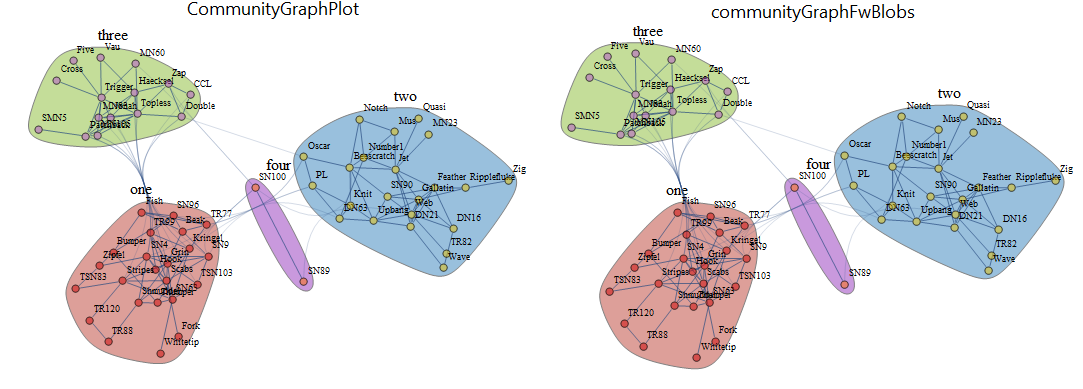
Row[Labeled[ReleaseHold@#[dsn,
   CommunityLabels -> (Style[#, 18] & /@ {"one", "two", "three", "four"}),
   ImageSize -> 600, opts], Style[#, 20, "Panel"], Top] & /@
 {HoldForm[CommunityGraphPlot], HoldForm[communityGraphFwBlobs]}]
With an exogenously given community structure as the second argument:
Row[Labeled[ReleaseHold[#[zkc, Partition[VertexList[zkc], 10, 10, 1, {}], opts]],
  Style[#, 20, "Panel"], Top] & /@
 {HoldForm[CommunityGraphPlot], HoldForm[communityGraphFwBlobs]}]
Input graph may have non-default VertexShapeFunction:
zkc2 = SetProperty[zkc, {VertexSize -> 1.5, VertexLabels -> Placed["Name", Center],
  VertexLabelStyle -> Directive[16, White, Bold],
  VertexShapeFunction -> "ConcaveHexagon"}];

Row[Labeled[ReleaseHold@#[zkc2,
  CommunityRegionStyle -> (Opacity[.3, #] & /@ ColorData[63, "ColorList"][[;; 3]]),
  ImageSize -> 500], Style[#, 20, "Panel"], Top] & /@
 {HoldForm[CommunityGraphPlot], HoldForm[communityGraphFwBlobs]}]
