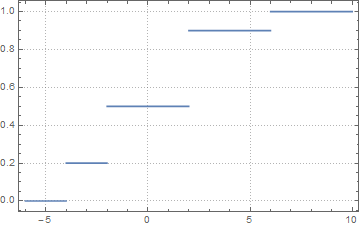
Update: Post-processing using custom Arrowheads:
g1 = Graphics[Disk[]];
g2 = Graphics[{EdgeForm[Thick], FaceForm[White], Disk[]}];

plt /. Line[x_] :> {Arrowheads[{{-.01, 0, g2}, {.0125, 1, g1}}], Arrow[x]}
Original post:
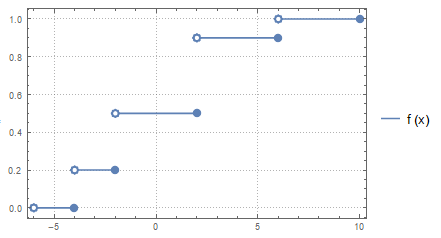
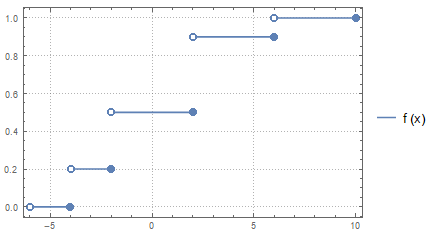
One approach is to post-process the plot output to add filled and an empty circles to the lines:
f[x_] := Piecewise[{{0, -Infinity < x <= -4}, {0.2, -4 < x <= -2},
                    {0.5, -2 < x <= 2}, {0.9, 2 < x <= 6}}, 1]
plt=Plot[f[x], {x, -6, 10}, PlotTheme -> "Detailed"];


plt/. Line[x_] :> {Line[x], AbsolutePointSize[8], Point[Last@x],
       AbsolutePointSize[8], Point[First@x],
      {White, AbsolutePointSize[5], Point[First@x]}}
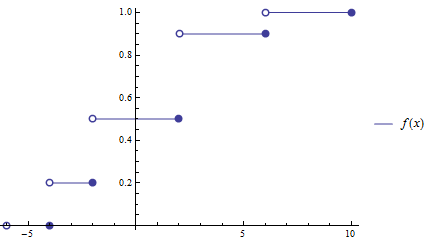
In version 9, you can specify the PlotStyle to add filled and empty circles to Line primitives (this trick doesn't seem to work in version 10):
Plot[f[x], {x, -6, 10}, PlotLegends -> "Expressions",
 PlotStyle -> ({#, AbsolutePointSize[8], Point[Last @@ #],
   Point[First @@ #], {White, AbsolutePointSize[5], Point[First @@ #]}} &)]
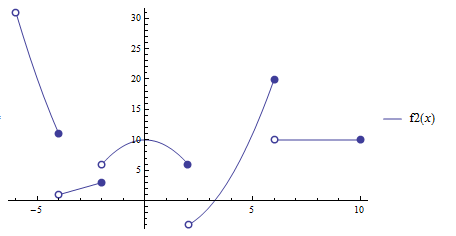
f2[x_] := Piecewise[{{x^2 - 5, -Infinity < x <= -4}, {x + 5, -4 <  x <= -2},
                    {10 - x^2, -2 < x <= 2}, {x^2 - 2 x - 4, 2 < x <= 6}}, 10]

Plot[f2[x], {x, -6, 10}, PlotLegends -> "Expressions",
 PlotStyle -> ({#, AbsolutePointSize[8], Point[Last @@ #],
   Point[First @@ #], {White, AbsolutePointSize[5], Point[First @@ #]}} &)]
