1
$\begingroup$

I have the following code

f[a_, b_] =ProbabilityDistribution[a/b^2*(1 - (1 + x/b) E^(-(x/b)))^(a - 1)*x E^(-(x/b)), {x, 
0, \[Infinity]}];
data = RandomVariate[f[13, 0.5], 25];
pars = FindDistributionParameters[data, f[a, b], {{a, 1}, {b, 1}}]
ll[a_, b_] = LogLikelihood[f[a, b] /. pars, data]
g[a_, b_] = NIntegrate[a/b^2*(1 - (1 + y/b) E^(-(y/b)))^(a - 1)*y E^(-(y/b)), {y, 0.01, 
x}]; 
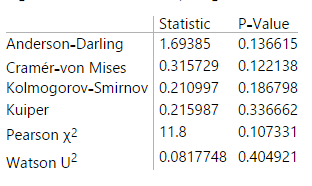
h = DistributionFitTest[data, f[13, 0.5], "HypothesisTestData"];
h["TestDataTable", All]
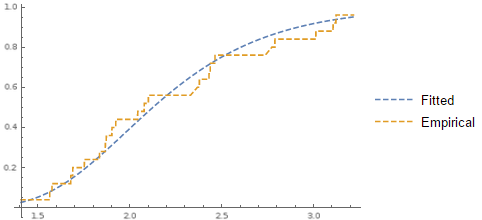
Plot[{g[a, b] /. pars, CDF[EmpiricalDistribution[data], x]}, {x, Min[data], Max[data]}, PlotStyle -> {Dashed, DotDashed}, PlotLegends -> {"Fitted", "Empirical"}, Exclusions -> None, AxesOrigin -> {Min[data], 0}]

Above code works fine, but I want to repeat above code fix number of times (say 100). Each time output will be different because of RandomVariate. I need such maximum likelihood parameters those maximize the LogLikelihood function (out of 100). FindMaximum may be used for this purpose. DistributionFitTest and following code should be applied only on maximum. I work on different ways but unsuccessful, please help me in this regard.

$\endgroup$

1 Answer 1

3
$\begingroup$
data10 = RandomVariate[f[13, 0.5], {10, 25}]; (* 10 data sets from distribution f *)

lls= LogLikelihood[EstimatedDistribution[#, f[a, b], {{a, 1}, {b, 1}}], #] & /@data10
(*{-32.4994, -25.2268, -21.9671, -26.8963, -25.9164, 
   -22.8958, -26.5247, -24.9622, -33.9319, -28.6512}*)

maxll=Block[{k=1}, MaximalBy[Last][
                     With[{dist = EstimatedDistribution[#, f[a, b], {{a, 1}, {b, 1}}]},
                          {dist,k++,LogLikelihood[dist, #]} ]& /@data10]][[1]]
(* {ProbabilityDistribution[147.385 \\[FormalX] E^(-2.38603 \\[FormalX]) 
                  (1-(1+2.38603 \\[FormalX]) E^(-2.38603 \\[FormalX]))^24.8883,
                  {\\[FormalX],0,\\[Infinity]}],
    3, -21.9671}

 dtmll = data10[[maxll[[2]]]];
 distmll = maxll[[1]];

 h = DistributionFitTest[dtmll, f[13, 0.5], "HypothesisTestData"];
 h["TestDataTable", All]

enter image description here

Plot[{CDF[distmll,x], CDF[EmpiricalDistribution[dtmll], x]}, 
    {x, Min[dtmll], Max[dtmll]},
    PlotStyle -> {Dashed, DotDashed}, PlotLegends -> {"Fitted", "Empirical"},
    Exclusions -> None, AxesOrigin -> {Min[dtmll], 0}]

enter image description here

$\endgroup$

Your Answer

By clicking “Post Your Answer”, you agree to our terms of service and acknowledge you have read our privacy policy.

Not the answer you're looking for? Browse other questions tagged or ask your own question.