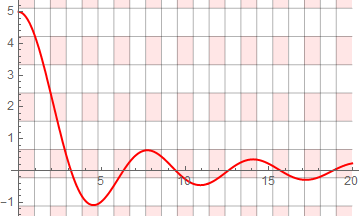
You could make a checkerboard with Mesh funtionality in ParametricPlot:
mesh =
 ParametricPlot[{v, u}, {u, -2, 6}, {v, 0, 20},
  MeshFunctions -> {#2 &, #1 &},
  MeshShading -> {{RGBColor[1, 0.9, 0.9], White}, {White, White}},
  Mesh -> {8, 20},
  BoundaryStyle -> None
 ]

Then set it as a background with Prolog:
Plot[5 Sinc[x], {x, 0, 20},
  PlotRange -> All,
  PlotStyle -> {Red, Thick},
  Prolog -> mesh[[1]]
]

This method is quite flexible as you have specific control over the MeshFunctions etc. For example with MeshFunctions -> {Log[Abs@#2] &, Sinc[#1] &} you get:

Automation
The method above as a function for ease of application.
Options[addCheckerboard] =
  {MeshFunctions -> {#1 &, #2 &},
   MeshShading   -> {{RGBColor[1, 0.9, 0.9], White}, {White, White}},
   BoundaryStyle -> None};

addCheckerboard[gr_Graphics, opts : OptionsPattern[ParametricPlot]] :=
 {⌊#⌋, ⌈#2⌉} & @@@ PlotRange[gr] /. {{x_, X_}, {y_, Y_}} :>
   Show[gr,
    Prolog ->
     ParametricPlot[{u, v}, {u, x, X}, {v, y, Y},
       opts,
       Mesh -> ({X - x, Y - y} - 1),
       Evaluate @ Options @ addCheckerboard
     ][[1]]
   ]
You should now be able to apply this to any Graphics object as follows:
plot =
  Plot[Evaluate[Table[n^2*BesselJ[n, x], {n, 4}]], {x, 0, 10},
   AspectRatio -> Automatic];

addCheckerboard[plot]

(AspectRatio -> Automatic is included in the example but not necessary for functionality.)
- You can change the fill color with
MeshShading and the grid color with MeshStyle.
- You can override the regular grid with different
MeshFunctions as above.


