1
$\begingroup$

I would like to plot the 2-D vector field:

VectorFieldPlot[{ x/Sqrt[x^2 + y^2], y/Sqrt[x^2 + y^2]}, {x, -5,  5}, {y, -5, 5} ]

but I encounter zero division at the origin. How to cast out the point {0,0}? I tried the Assumptions -> x <> 0 && y <> 0, but the string Assumptions is red and seems that it isn't available for VectorFieldPlot.

Furthermore, for another vector field, I would need to cast out the semi-line "(x,0), x in ( - infininty, 0 >".

To summarize: the question is how to restrict the (plot) domain of a vector field?

Could you help?

Thank you and wish you a nice day

marfi

$\endgroup$
1
  • 1
    $\begingroup$ Stackexchange etiquette: If your problem is solved, you should consider accepting the best answer. $\endgroup$
    – Philipp
    Commented Jan 21, 2015 at 11:52

2 Answers 2

2
$\begingroup$

You want the RegionFunction parameter. This should be a raw Function object that returns True in the region that you do want plotted. Examples:

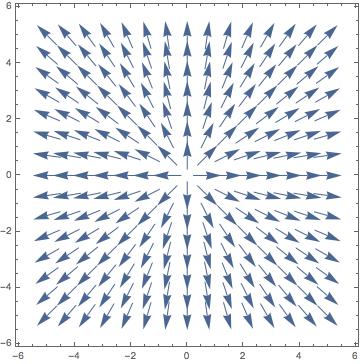
VectorPlot[{x/Sqrt[x^2 + y^2], y/Sqrt[x^2 + y^2]}, {x, -5, 5}, {y, -5, 5},
 RegionFunction -> Function[{x, y}, x^2 + y^2 > (0.1)^2]]

Vector plot with origin excised

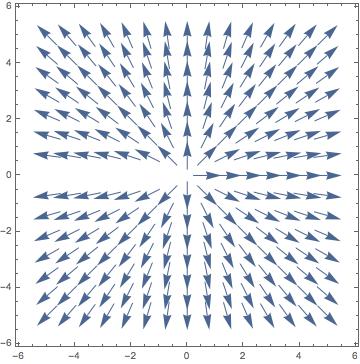
VectorPlot[{x/Sqrt[x^2 + y^2], y/Sqrt[x^2 + y^2]}, {x, -5, 5}, {y, -5, 5},     
 RegionFunction ->  Function[{x, y}, (y^2 > (0.1)^2) || (x > 0.1)]]

Vector plot with negative x-axis excised

$\endgroup$
1
$\begingroup$

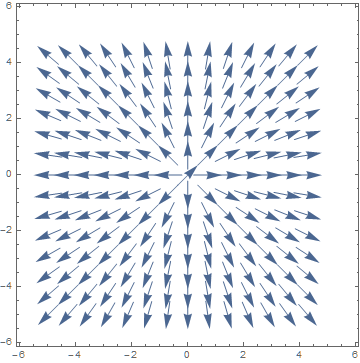
Use VectorPlot instead.

VectorPlot[{x/Sqrt[x^2 + y^2], y/Sqrt[x^2 + y^2]}, {x, -5, 5}, {y, -5, 5}]

vectorplot

$\endgroup$

Your Answer

By clicking “Post Your Answer”, you agree to our terms of service and acknowledge you have read our privacy policy.

Not the answer you're looking for? Browse other questions tagged or ask your own question.