Wanted to see if anyone could help me out here.
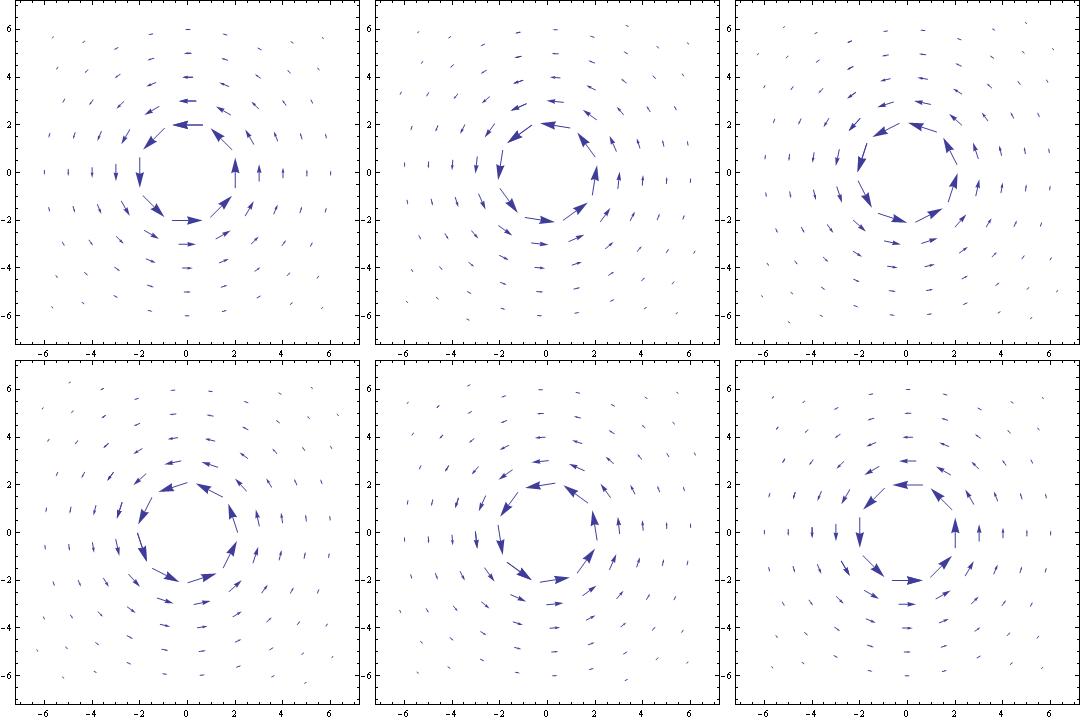
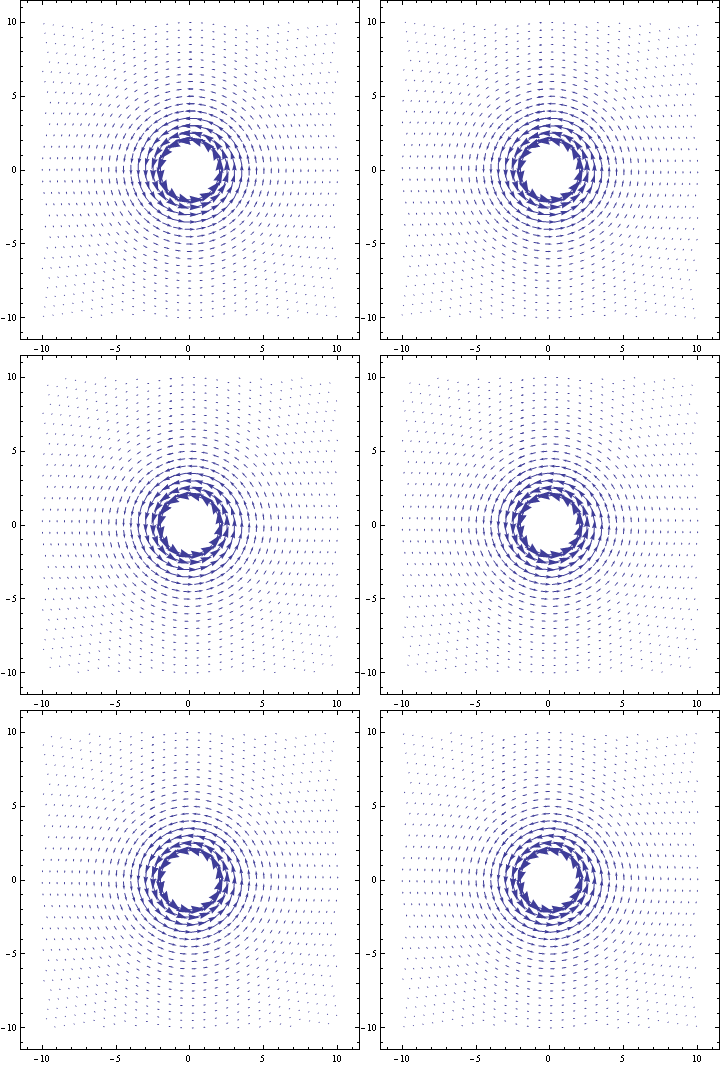
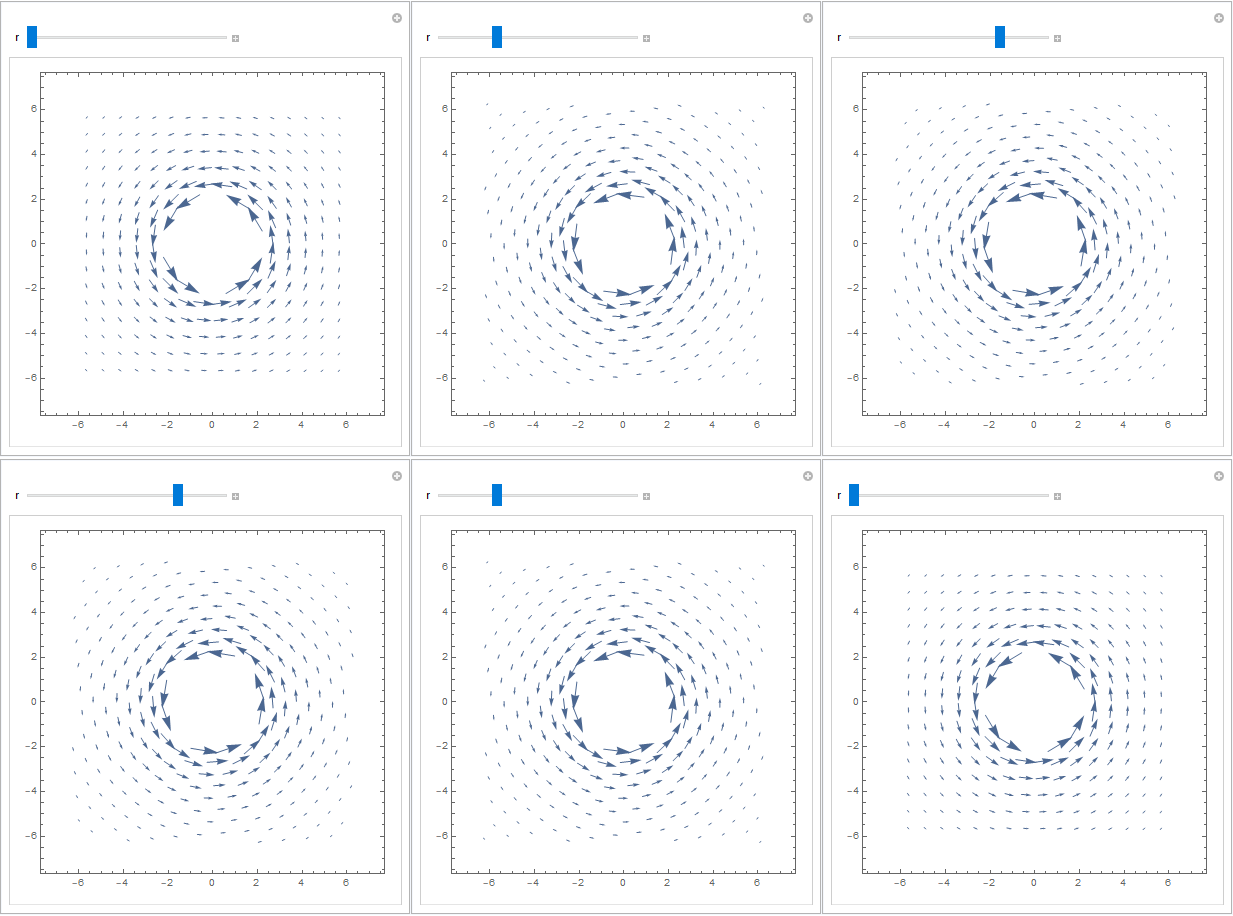
I interested in seeing if it's possible to animate this vector plot I've created.
r[x_, y_] := Sqrt[x^2 + y^2];
R2[x_, y_] := r[x, y]^2 + 1 + 2/r[x, y];
phidot[x_, y_] := If[r[x, y] >= 2, 2/((r[x, y])^3 + r[x, y] + 2), 0];
vx[x_, y_] := -y phidot[x, y];
vy[x_, y_] := x phidot[x, y];
VectorPlot[{vx[x, y], vy[x, y]}, {x, -2 \[Pi], 2 \[Pi]}, {y, -2 \[Pi],
2 \[Pi]}]
The equation used to create this vector field describes the speed at which space is drug by an extreme Kerr black hole. As you get closer to the event horizon, r = 1, space is drug faster, hence the bigger vectors. If possible, what I'd like to do is to get the vectors to circle around the origin in a similar manner, with some representation of their magnitude, at least relative to each other. If anyone could offer some assistance, I'd really appreciate it.
As a bonus, it would be cool if any different colors or background were possible.
Thanks!


