2
$\begingroup$

I have a matrix that looks like this

matrix = SparseArray[
             {{i_, i_} -> Eo, {i_, j_} /;
               Abs[i - j] == 1 -> -t, {i_, j_} /; 
               i == 1 && j == NA -> -t, {i_, j_} /; 
               j == 1 && i == NA -> -t}, {NA, NA}];

MatrixForm[matrix];

where the eigenvectors of this matrix are equal to ϕm. I want to show that these coefficients ϕm are wave-like and therefore have been told to take the Fourier Transform of the individual eigenvectors to find it's corresponding frequency peak.

I have tried to make a table and list of the eigenfunctions and then take a Fourier Transform, but it doesn't seem to be working.

Does anyone have any ideas?

$\endgroup$
8
  • $\begingroup$ "I have tried to make a table and list of the eigenfunctions and then take a Fourier Transform, but it doesn't seem to be working." Post this code please so that we can help you. $\endgroup$ Commented Nov 22, 2014 at 15:21
  • $\begingroup$ ListLinePlot[(Abs@Fourier@Eigenvectors[matrix])^2] use this line to get a simple result. Try to adapt it to work for your other cases. $\endgroup$
    – Sektor
    Commented Nov 22, 2014 at 15:36
  • $\begingroup$ Thank you! I'll try that and let you know $\endgroup$
    – Jasmine9
    Commented Nov 22, 2014 at 15:37
  • 1
    $\begingroup$ @Sektor: Shouldn't that be Fourier/@Eigenvectors[...], instead of Fourier@Eigenvectors[...]? Otherwise, you are taking a 2D Fourier transform of the basis, instead of taking the 1D Fourier transforms of the individual eigenstates. $\endgroup$ Commented Nov 22, 2014 at 15:40
  • 1
    $\begingroup$ @Jasmine9: By the way, this problem actually has a closed-form solution, so numerical simulations are unnecessary (use circulant symmetry). I'll post an answer explaining why this is the case shortly. $\endgroup$ Commented Nov 22, 2014 at 15:41

1 Answer 1

7
$\begingroup$

Sektor has helpfully provided a way to numerically plot the Fourier transform of the eigenstates, as follows. First, create the matrix:

Eo = 1;
t = 0.2;
NA = 100;
matrix = SparseArray[{{i_, i_} -> 
     Eo, {i_, j_} /; Abs[i - j] == 1 -> -t, {i_, j_} /; 
      i == 1 && j == NA -> -t, {i_, j_} /; 
      j == 1 && i == NA -> -t}, {NA, NA}];

You can then Map Fourier onto the individual eigenstates, and plot some of the results:

dat = (Abs@(Fourier /@ Eigenvectors[matrix]))^2;
GraphicsGrid@
 Partition[
  Table[ListLinePlot[dat[[1 + 5 k]], PlotRange -> All, 
    PlotLabel -> "Eigenstate " <> ToString[1 + 5 k], 
    ImageSize -> 300], {k, 0, 19}], 5]

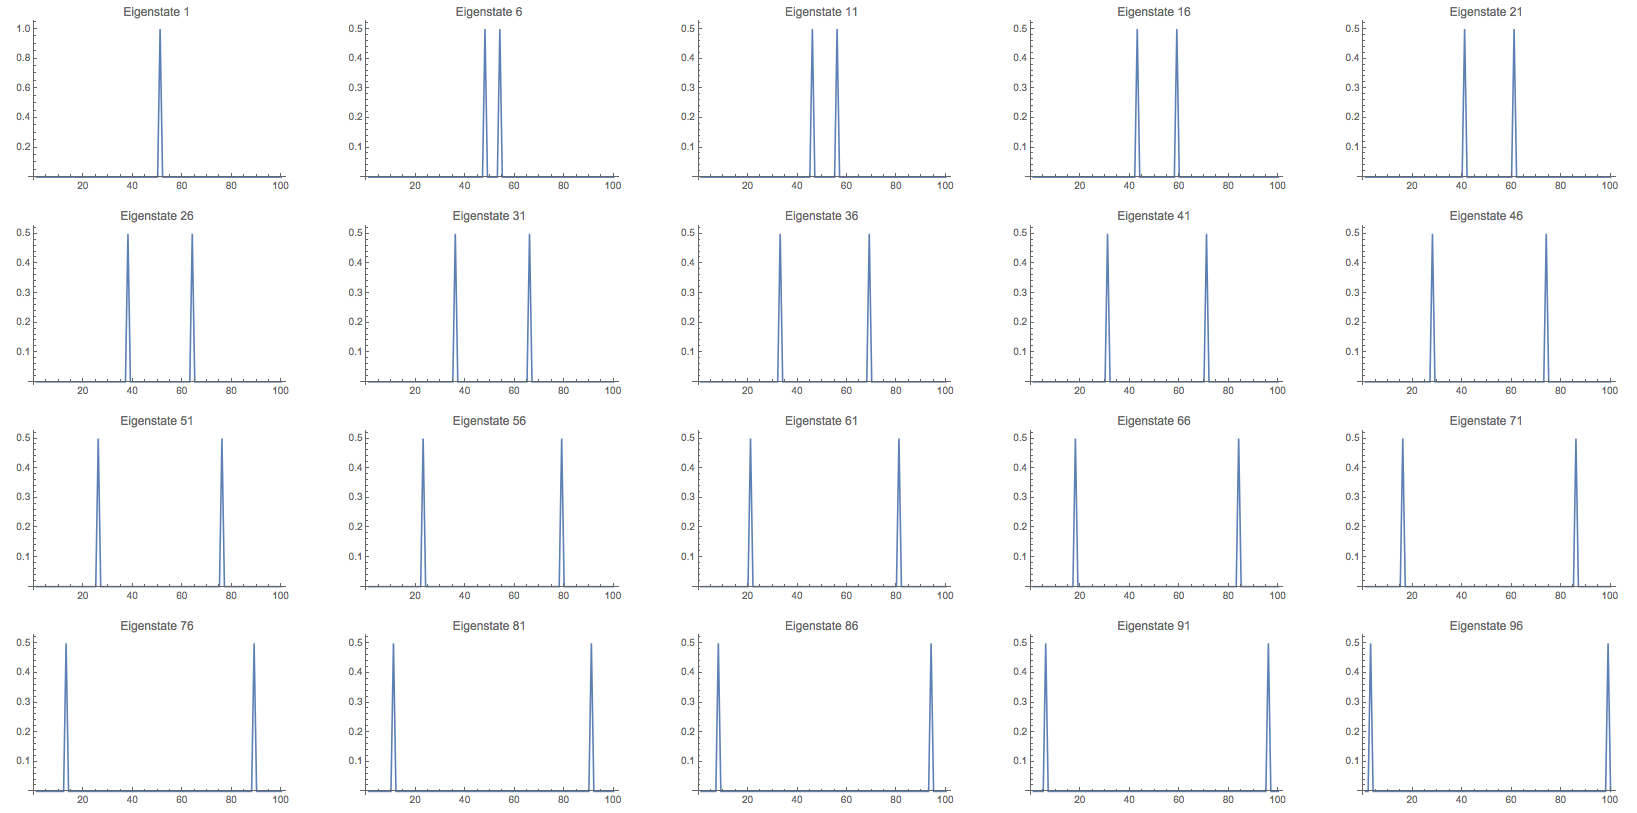
which produces the following diagram (right-click and open the image below in a new tab to view it in full size):
enter image description here

You'll notice a pattern here: the spectral domain of the eigenstates appear to be counterpropagating plane waves.

As it turns out, this can be made mathematically rigorous by exploiting the circulant Hermitian symmetry of the matrix. Circulant matrices are diagonalized by the DFT operator, and thus the eigenvectors of a circulant matrix are given by DFT basis plane waves:

$$\mathbf{v}_k=\left(1,\omega^k,\omega^{2k},\ldots,\omega^{(n-1)k}\right)^\mathsf{T}$$

where $\omega$ is the $n$th primitive root of unity.

However, you'll notice that this appears to contradict the preceding graphic, which shows two frequency components in each eigenstate. The origin of this behavior is due to the multiple-degeneracy of the eigenspectrum, since a circulant matrix has eigenvalues

$$\lambda_k=\sum_{j=0}^{n-1}c_j\omega^{(n-j)n}$$

where the $c_j$ are the basis entries that generate the circulant matrix. And you can evaluate this for yourself to see that almost every eigenvalue is doubly-degenerate; LAPACK has a habit of choosing degenerate substate basis vectors in such a way as to force them to be purely-real in the case of Hermitian input, and that's why you see double-spikes in the frequency spectrum for most of the eigenstates (the sum of two counterpropagating plane waves is a purely-real wave).

$\endgroup$
2
  • $\begingroup$ Thank you so much! This was very helpful! How would I go about converting the frequencies to wavelength in order to find the wavenumber k? Have been trying to use a Position function to find the frequency, but want to avoid doing this manually.. Sorry for many questions! and again, thanks so much! @DumpsterDoofus $\endgroup$
    – Jasmine9
    Commented Nov 22, 2014 at 16:32
  • $\begingroup$ @Jasmine9: I think wavelength should be $\Delta/m$, where $\Delta$ is the length of the interval, and $m$ is the number of oscillations that the wave makes. If you learn about the discrete Fourier transform (Fourier), you should be able to figure out what $m$ is from the graphics on your own, but for now you can use the fact that a spike at position 1 means 0 oscillations, a spike at position 2 means 1 oscillation, etc. I'd also recommend taking a swim through the Documentation Center (see Help > Wolfram Documentation), it's literally the best documentation ever written by the human race. $\endgroup$ Commented Nov 22, 2014 at 16:41

Your Answer

By clicking “Post Your Answer”, you agree to our terms of service and acknowledge you have read our privacy policy.

Not the answer you're looking for? Browse other questions tagged or ask your own question.