6
$\begingroup$

When I plot

PolarPlot[1/(1+Cos[6-t]), {t,0,2\[Pi]}, PlotRange->{{-4,4},{-4,4}}, PlotStyle->Dashed]

everything works normally, but when I change the numerator to 2,

PolarPlot[2/(1+Cos[6-t]), {t,0,2\[Pi]}, PlotRange->{{-4,4},{-4,4}}, PlotStyle->Dashed]

this causes Mathematica to freeze and have to kill the process. Any idea what is going on?

I'm using 10.0.0 on Linux, but I had the same issue with 10.0.0 OSX.

If I take away the PlotStyle, it works. If I take away PlotRange, it works. If I change Cos[6-t] to Cos[t], it works.

$\endgroup$
4
  • $\begingroup$ Good question. Actually this happens with the first plot as well for me, with Mathematica 10.0.0 and OS X. Changing Cos[6-t] to Cos[t] does not resolve it for me either. $\endgroup$
    – C. E.
    Nov 11, 2014 at 1:21
  • 1
    $\begingroup$ on V10.1 windows 7, I get no crash and empty plot? !Mathematica graphics ps. for problem like this it is best to give version number and platform. $\endgroup$
    – Nasser
    Nov 11, 2014 at 1:27
  • $\begingroup$ It gives two nice blank plots on V9 $\endgroup$ Nov 11, 2014 at 2:44
  • $\begingroup$ ^edited to add version number(s) -- 10.0.0 on Linux (but I see the same behavior with 10.0.0 on OSX) $\endgroup$ Nov 12, 2014 at 2:20

2 Answers 2

3
$\begingroup$

Too long for a comment and maybe just an observation.

I'm on 10.0 for Mac OS X x86 (64-bit) (September 10, 2014) and have also a kind of freeze, the rainbow shell comes up and rotates for 10-15 seconds. This effect again fetches 3-5 times. Very uncomfortable ...

But if I set PlotRange -> 4 and Performance Goal -> "Speed" I have not freeze at all.

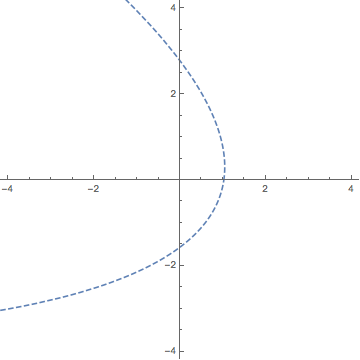
PolarPlot[1/(1 + Cos[6 - t]), {t, 0, 2 \[Pi]}, PlotRange -> 4, 
 PlotStyle -> Dashed, PerformanceGoal -> "Speed"]

enter image description here

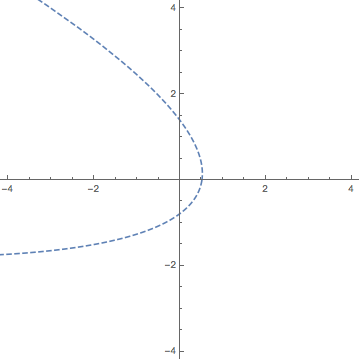
PolarPlot[2/(1 + Cos[6 - t]), {t, 0, 2 \[Pi]}, PlotRange -> 4, 
 PlotStyle -> Dashed, PerformanceGoal -> "Speed"]

enter image description here

$\endgroup$
3
  • $\begingroup$ Thanks @Lou, the PerformanceGoal option causes it not to freeze up. $\endgroup$ Nov 12, 2014 at 2:23
  • $\begingroup$ @Jacob Schwartz, My pleasure! $\endgroup$
    – user9660
    Nov 12, 2014 at 3:58
  • $\begingroup$ (+1) This workaround works for MMa 10.0.1 under Win7 x64. $\endgroup$ Nov 12, 2014 at 10:38
2
$\begingroup$

the plot is empty when the upper limit of t is 2 Pi. I am not sure why. also I got problem when the PlotStyle->Dashed. Not sure why.

This gives the plot.

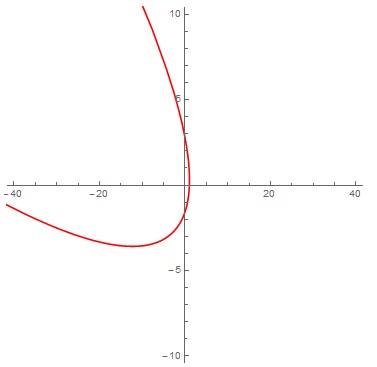
PolarPlot[2/(1 + Cos[6 - t]), {t, 0, 2 \[Pi] - .1}, AspectRatio -> 1, 
 PlotRange -> {{-40, 40}, {-10, 10}}, PlotStyle -> Red]

enter image description here

$\endgroup$
1
  • $\begingroup$ A funny thing. If I try to repeat the above solution, if works. It still works with the option PlotRange -> {{-4, 10}, {-5, 5}} . And with such an option one can make sure that the maximum value of x is about one. Therefore, I expect that the option PlotRange -> {{-4, 2}, {-5, 5}} will simply give a more detailed view. Instead I see an empty plot. It is Mma 10.0, Win7. Looks very much like a bug for me. $\endgroup$ Nov 11, 2014 at 9:10

Your Answer

By clicking “Post Your Answer”, you agree to our terms of service and acknowledge that you have read and understand our privacy policy and code of conduct.

Not the answer you're looking for? Browse other questions tagged or ask your own question.