3
$\begingroup$

I want to plot an equation in elliptical coordinates. In the traditional elliptical system, Ellipse and hyperbola shares the same confocal point. Is there a plot function that draws a function in this system? I do not want to parameterized in regular Cartesian. This will defeat the purpose. For example. For example, having nu as the elliptical coordinate and Theta as the Hyperbolic coordinate, how I plot the hyperbolic function

nu=3(Theta)-2

UPDATE (March 8, 2020):

I must add that my above statement "defeat the purpose" is a wrong use of wording and shows my misunderstanding in how Mathematica plot functions. There is no native elliptical coordinate system nor ellipsoidal coordinate functions. For those interested in transformation of elliptical system, please follow my post in the subject.
SphericalPlot3D of an OblateSpheroid via coordinate transformation

$\endgroup$
4
  • 3
    $\begingroup$ What does it mean " This will defeat the purpose"? What is the "purpose"? $\endgroup$ Commented Nov 8, 2014 at 14:16
  • $\begingroup$ Defeat the purpose of having a different coordinate system still linked to the cartesian coordinates. $\endgroup$ Commented Nov 8, 2014 at 16:22
  • 1
    $\begingroup$ The meaning of the term "elliptical coordinate system" is that it provides a parametrization of points in a Cartesian frame, where every point is the intersection of an ellipse and a hyperbola. So to plot in this coordinate system is synonymous to forming Cartesian plot in the end, and therefore it is not clear at all what you mean by not having elliptical coordinates linked to the Cartesian ones. The name "elliptical coordinates" itself comes from the elliptical shape of the coordinate lines when drawn in Cartesian coordinates! $\endgroup$
    – Jens
    Commented Nov 8, 2014 at 20:02
  • $\begingroup$ Explicit equations to transform from Cartesian to elliptic coordinates are given below researchgate.net/publication/… $\endgroup$
    – Che Sun
    Commented Feb 26, 2017 at 6:43

2 Answers 2

6
$\begingroup$

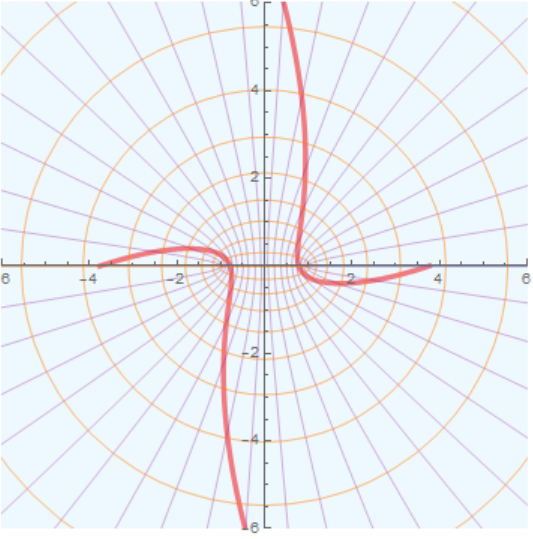
I may have "defeated the purpose":

f[u_, v_, c_] := c {Cos[u], Sin[u]} {Cosh[v], Sinh[v]}
Show[ParametricPlot[{f[u, 3 u - 2, 1], f[u, 3 u - 2, -1]}, {u, 0, 
   2 Pi}, PlotRange -> {{-6, 6}, {-6, 6}}, 
  PlotStyle -> Directive[Red, Thickness[0.01]]],
 ParametricPlot[{f[u, v, 1], f[u, v, -1]}, {u, 0, 2 Pi}, {v, 0, 5}, 
  MeshFunctions -> {#3 &, #4 &}, 
  Mesh -> {Range[0, 2 Pi, 0.3], Range[0, 2 Pi, 0.3]}, 
  MeshStyle -> {Purple, Orange}, PlotRange -> {{-6, 6}, {-6, 6}}, 
  PlotStyle -> {LightBlue, LightBlue}]]

enter image description here

$\endgroup$
6
$\begingroup$

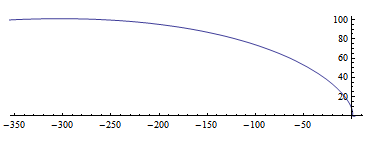
I'm confused by the "defeat the purpose" statement, but here's a shot. I'm well out of my league here, and tossing this answer out since I was interested in learning something about coordinate transformations in Mathematica.

tr = CoordinateTransformData["Elliptic" -> "Cartesian", 
   "Mapping", {nu, theta}] /. nu -> 3 theta - 2
ParametricPlot[% /. \[FormalA] -> 1, {theta, 0, Pi}]

enter image description here

I'm unsure how to handle the Formal A.

$\endgroup$

Your Answer

By clicking “Post Your Answer”, you agree to our terms of service and acknowledge you have read our privacy policy.

Not the answer you're looking for? Browse other questions tagged or ask your own question.