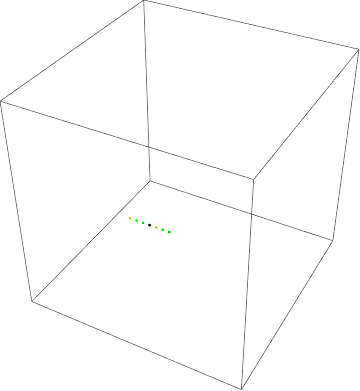
I welcome you to clarify your question a bit further as to what exactly you want to do with the data, and I will update this answer a bit further. For now, I invite you to see the following method for converting your coordinates to spherical ones:
Given a set of data
set = {{-6.1935, 0.1505, -6.4695, 0, 1, .01}, {-5.5125, 0.1505, -6.4695, 0,
  1.1, .04}, {x, y, z, Ex, Ey, Ez}};
We can convert merely the first three entries of each item in the list using ToSphericalCoordinates and rejoin the list up
{ToSphericalCoordinates@set[[All, ;; 3]], set[[All, -3 ;;]]} //
  Transpose // Join @@@ # &

(*{{8.95748, 2.37784, 3.1173, 0, 1, 0.01}, {8.50087, 2.43571, 3.1143, 0,
   1.1, 0.04}, {Sqrt[x^2 + y^2 + z^2], ArcTan[z, Sqrt[x^2 + y^2]],
  ArcTan[x, y], Ex, Ey, Ez}}*)
From here, we can use similar techniques using Part in order to plot with the coordinates being styled by the E-values.
As an update, using your new set of data, you can play with this a bit more:
set = {{-6.1935, 0.1505, -6.4695, 41186.7,
    68876.6, -8859.19}, {-5.5125, 0.1505, -6.4695, 3914.28, 149235,
    15848.8}, {-4.8315, 0.1505, -6.4695, -12290.5, 16073.4,
    3135.46}, {-4.1505,
    0.1505, -6.4695, -14043.7, -95001.8, -16983}, {-3.4695,
    0.1505, -6.4695, 36911.1, 57960.9, 6953.94}, {-2.7885,
    0.1505, -6.4695, -20771.9, 41121.2, -13638.4}, {-2.1075,
    0.1505, -6.4695, -18273.4, 27652.3, -21044.5}};
colorSystem = RGBColor;
setsplit = {set[[All, ;; 3]],
     colorSystem[#/Norm[#]] & /@ set[[All, -3 ;;]]} // Transpose //
   Join@# &;
Graphics3D[{Directive[#[[2]]], Point[#[[1]]]} & /@ setsplit,
 PlotRange -> {{-10, 10}, {-10, 10}, {-10, 10}}]

While the color changes, your coordinates don't seem to change much in terms of on a spherical surface. This should work pretty readily with your whole set of data as long as you name it set. You can change the color system used by changing the value of colorSystem.


{Ex,Ey,Ez}portions of the set to be represented? $\endgroup$