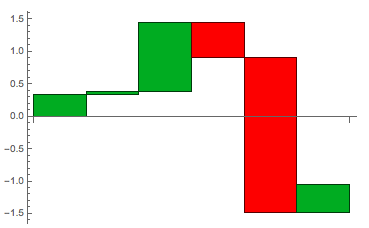
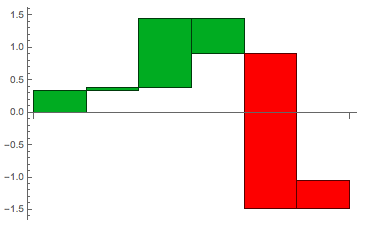
I'm trying to get a BarChart to colour negative valued bars red and positive valued bars green but I'm having a time trying to do it. My latest attempt is:
data = {0.34`, 0.04`, 1.07`, -0.54`, -2.4`, 0.44`};
t = Piecewise[{{# >= 0, Green}}, Red] &;
BarChart[data, ChartLayout -> "Stepped", BarSpacing -> None,
 ColorFunction -> t,
 ColorFunctionScaling -> False]
However this still colours the bars in the default colour. May someone tell me what I am doing wrong. I thought this would be pretty simple. I'm not getting an error. It just is ignoring the ColorFunction. I'm on 10.0.1
Thanks,
Edmund


