36
$\begingroup$

Dataset rather conveniently truncates the display of a dataset that has many rows. However, occasionally, I would like to show more of a dataset without having to convert to e.g. a TableForm. In addition, I like the appearance of Dataset's output.

How can I set the truncation length, to be, e.g. Infinity?

titanic=ExampleData[{"Dataset","Titanic"}]
$\endgroup$
2
  • $\begingroup$ Related: 54607. $\endgroup$ Commented Sep 30, 2014 at 21:46
  • $\begingroup$ For those willing to look at TableForm, just pair it with Normal to get a simple dump of the dataset. E.g. Normal[titanic[[;;100]]]//TableForm for the first hundred rows. $\endgroup$
    – duozmo
    Commented Nov 7, 2015 at 17:46

5 Answers 5

30
$\begingroup$

If you are willing to use an undocumented and future-incompatible hack you can set the global variable Dataset`FormattingCompound`PackagePrivate`$Limit to larger than its default value of 64 to see more of the dataset. For example, Dataset[RandomInteger[10, {1000, 5}]] shows 16 rows by default, but by doubling $Limit to 128 you will see 32 rows, etc.

I will improve this in future, but I can't promise a particular time. When Dataset formatting improves it will get much better, though -- that I can promise :-).

EDIT: In 10.0.2 the global variable has been renamed to Dataset`$ElisionThreshold, and has a note in the documentation.

EDIT 2: I broke my own promise. The formatting did get a bit better in various ways, but didn't solve the deeper issues.

$\endgroup$
5
  • 2
    $\begingroup$ In one study we indexed 250m LeafCount in a deep tree including time series, relational tables and metadata. Need a Dataset browser (interactive). Not all the data can be displayed - that's obvious - but there's no fixed format that can know what level or branch users are interested in at any given time. $\endgroup$ Commented Oct 7, 2014 at 19:08
  • $\begingroup$ @alancalvitti yeah it's tricky. are you coming to the Wolfram Technology Conference, by any chance? I will be there and talking about Dataset among other things. Want be nice to sit down and brainstorm ideas about how to make a scalable Dataset browser. $\endgroup$ Commented Oct 9, 2014 at 3:30
  • $\begingroup$ Unfortunately, have a conflicting schedule, but I would like to attend WTC next year. Are there similar opportunities until then? If not F2F then w/ screen-sharing like joinme? $\endgroup$ Commented Oct 10, 2014 at 16:53
  • 7
    $\begingroup$ M11 adds scrollbars! I'm not sure what $ElisionThreshold does anymore, but Dataset`$DatasetTargetRowCount changes how many rows visible in one scrolling view. $\endgroup$
    – ZachB
    Commented Sep 8, 2016 at 19:09
  • $\begingroup$ Neither variable seems to have any effect for me. Has there been another name-change? (I'm using one of the nightly builds of M11.1.1.) $\endgroup$
    – 76 Pinto
    Commented Dec 2, 2017 at 1:35
28
$\begingroup$

Until scrollbars are implemented...

... I have found this little function for simple tabular data to work out fine with everyday work. One can size the viewer window (and probably use the tricks posted so far to extend the range of formatted output?).

Also you can set a specific column (numerically) to be a repeated column, eg. to remain fixed while the window is scrolled horizontally.

viewDataset::usage ="viewDataset[dataset] displays a dynamic dataset output,\
   where the window, controlled by the Option \"WindowSize\", can be\        
   scrolled via sliders controlling the left hand corner (row,col).";

Options[viewDataset] = {
   "WindowSize" -> {10, 10},
   "RepeatColumn" -> 1
};

viewDataset[ ds_Dataset, opts : OptionsPattern[viewDataset]  ] := DynamicModule[
  {
    row, rowWidth, maxRow, winSizeRow,
    col, colWidth, maxCol, winSizeCol, repeatCol, colRange,
    val
  },

  {maxRow, maxCol} = Dimensions @ ds;
  repeatCol = If[
    OptionValue["RepeatColumn"] === None,
    (* then *) None,
    (* else *) Clip[ Floor@OptionValue["RepeatColumn"], {1, maxCol}]
  ];

  (* evaluate the option-values for WindowSize *)
  winSizeRow = Switch[ val = OptionValue[WindowSize][[1]],
    All, maxRow,
    _ , Floor@val
  ]; 
  winSizeCol = Switch[ val = OptionValue[WindowSize][[2]],
    All, maxCol,
    _, Floor @ val
  ];

  (* determine the viewer's window-size *)
  rowWidth = Clip[ winSizeRow, {1, maxRow} ];
  colWidth = Clip[ winSizeCol, {1, maxCol} ];

  (* ouput sliders and clipped dataset *)
  Column[
    {
      Row[{
        Style["row ", "DisplayFormula", Gray], 
        Slider[ Dynamic[row], {1, maxRow - rowWidth + 1, 1}], 
        Dynamic[row]
      }],
      Row[{
        Style["column ", "DisplayFormula", Gray], 
        Slider[ Dynamic[col], {1, maxCol - colWidth + 1, 1}], 
        Dynamic[col]
      }],
     Dynamic[ 
       ds[[
         row ;; (row + rowWidth - 1), 
         (colRange = Range[col, col + colWidth - 1]) /. col ->
           Switch[repeatCol, None, col, _, repeatCol] 
       ]] // Normal // Dataset
     ]
    }
  ] (* end Column *)
]

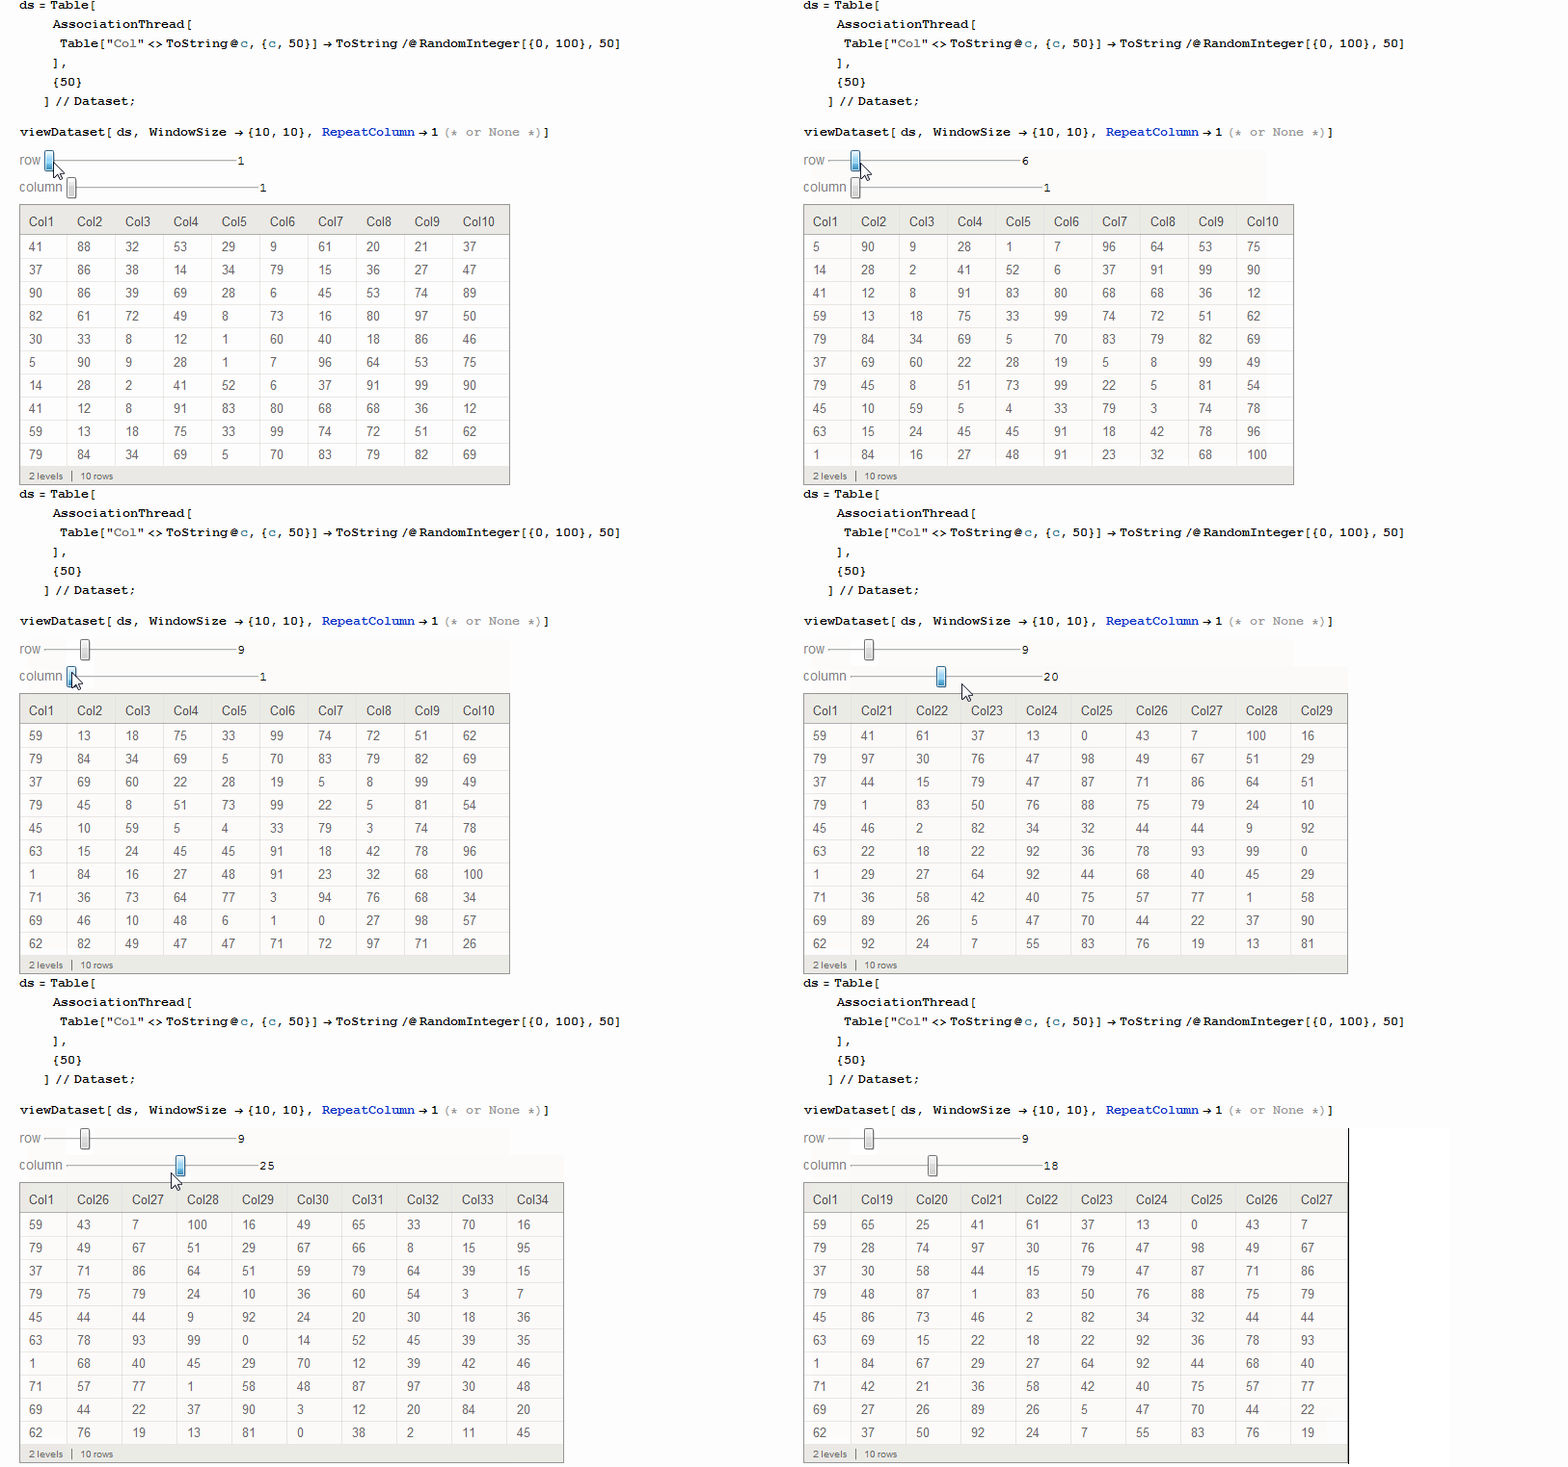
viewDataset in action

ds = Table[ 
       AssociationThread[
         Table["Col" <> ToString@c, {c, 50}] -> 
         ToString /@ RandomInteger[{0, 100}, 50] 
       ], 
     {50}
     ] // Dataset;

viewDataset[ ds, WindowSize -> {10, 10}, RepeatColumn -> 1 (* or None *)]

viewDataset

$\endgroup$
0
15
$\begingroup$

I have great sympathy for your frustration. I complained about this to Wolfram tech support back in August. This is a condensed version of my email.

I really like the new structured datasets introduced in V10. However, I find one aspect of working with them extremely frustrating: the way they are displayed in output cells. The display format is very handsome, but it can not be scrolled. This is a terrible oversight. Every dataset, except for a few toys, begs for scrolling. Please, please, provide a scrollable output format for datasets.

Their answer:

I have sent a note to our development team about including a scroll bar with the output of a Dataset. I will let you know if I hear anything back.

I never heard anything more, and V10.0.1 did not fix the problem. So it appears that we must wait on the next release or even latter.

$\endgroup$
1
  • 3
    $\begingroup$ I believe your comment made it into an (existing) bug report, but I don't always have time to respond to bug reports that come through support. I do remember commenting on this particular issue in another stackexchange question, however. $\endgroup$ Commented Oct 6, 2014 at 20:46
13
$\begingroup$

That functionality is, actually, included. But it is not resident in the Dataset itself; as is always the case in Mathematica, you have to explicitly apply it.

The expectation of how you graphically manipulate data in Mathematica notebook UI revolves around functional approaches that you apply yourself with built-in functions like "Manipulate." In this case, you can create your own scrolling region with the Manipulate function, i.e.:

Manipulate[ yourdataset[startrow ;; startrow + numrows, All],
 {startrow, 1, yourdataset//Length, 1}, 
{numrows, 1, Dataset`$ElisionThreshold/4, 1} ]

This will create two scrollbars, the first of which will let you scroll through a windowed view of your data, the second slider will set the number of rows in your window (up to max of the limit defined by ElisionThreshold, which you can change per previous post). It will function exactly as you would expect in a built-in solution.

$\endgroup$
4
$\begingroup$

Helllo there,

I have encountered the same issues with Dataset. Resurecting one of my old thread (I have a tag for being a Necromancer; ([Previous post on generic display] [1]: How can I create an advanced grid interface?), I have adapted the function suggested in the link to Dataset (essentially the post was a discussion on displaying a datastructure that predated Dataset and filled its role).

Again, I like the split between static and dynamic display. Here is the static one:

Options[DisplayTableWithHeaders]={ HeadersCols->{}, HeadersRows->{},
 Title->"", SelectItems->All, SelectRows->False,
 SelectCols->All, NbRows->3, NbCols->3, BuilderHeaderRows->(First[#2]&), BuilderHeaderCols->(First[#2]&), ColorBckGrd->GrayLevel[0.5`],
 ItemStyle->{{Directive[FontFamily->"Helvetica",FontWeight->B‌​old,FontSize->Medium‌​],None},{Directive[F‌​ontFamily->"Helvetic‌​a",FontWeight->Bold,‌​FontSize->Medium],No‌​ne},{{1,1}->Directiv‌​e[FontSize->Medium],‌​{1,2}->Directive[Fon‌​tWeight->Bold]}},Ite‌​mSize->Full,Alignmen‌​t->{{Left,Center},{C‌​enter,Center}},Divid‌​ers->LightGray}; 

DisplayDataset[ds_Dataset, opts : OptionsPattern[]] := 
     DisplayTableWithHeaders[Rest@Normal@ds[[All, Values]], 
      Append[{opts}, HeadersCols -> Normal@Keys[ds[[1]]]]];

where the implementation of DisplayTableWithHeaders is to be found in the post mentioned above.

And here is the dynamic one, which out of laziness, will constitute all the documentation about the options in the previous function:

DisplayDatasetLive[results_, headerscols_: {}, 
  columnPickerCols_: True, headersrows_: {}, columnPickerRows_: False,
   opts : OptionsPattern[]] := 
 Module[{(*nbRows,nbCols,selRows,selCols,controlRows,controlCols*)
   headerscolsFinal},
  If[headerscols == {}, headerscolsFinal = Normal@Keys[results[[1]]], 
   headerscolsFinal = headerscols];
  controlCols = 
   If[columnPickerCols, {{selCols, headerscolsFinal, 
      "Select cols from:"}, headerscolsFinal, 
     ControlType -> TogglerBar}, 
    Sequence @@ {{{selCols, "StartEnd", "View cols:"}, {All, 
        "StartEnd", "EveryOther"}}, {{nbCols, 1, 
        "Number cols for display:"}, 1, Length[results\[Transpose]], 
       1}}];
  controlRows = 
   If[columnPickerRows, {{selRows, headersrows, "Select rows from:"}, 
     headersrows, ControlType -> TogglerBar}, 
    Sequence @@ {{{selRows, "StartEnd", "View rows:"}, {All, 
        "StartEnd", "EveryOther"}}, {{nbRows, 1, 
        "Number of rows for display:"}, 1, Length[results], 1}}];
  Manipulate[
   DisplayDataset[results, HeadersCols -> headerscolsFinal, 
    HeadersRows -> headersrows, SelectRows -> selRows, 
    NbRows -> nbRows, NbRows -> If[columnPickerRows, 1, nbRows], 
    SelectCols -> selCols, NbCols -> If[columnPickerCols, 1, nbCols], 
    FilterRules[Flatten[{opts}], Options[DisplayTableWithHeaders]]], 
   Evaluate[controlRows], Evaluate[controlCols]]]

The end result is a dynamic display that have features that extend gwr's one to allow very common investigation cases: seeing the begining and the end, every other row (every n rows actually), pick the colums and so on....

The hope is that Taliesin reads this post and find some features interesting enough to recycle them into a proper, solid, native implementation.

Best

Trad

$\endgroup$
5
  • $\begingroup$ It might be useful to add the Options: $\endgroup$
    – Trad Dog
    Commented Nov 7, 2015 at 12:36
  • $\begingroup$ Options[DisplayTableWithHeaders]={ HeadersCols->{}, HeadersRows->{}, Title->"", SelectItems->All, SelectRows->False, SelectCols->All, NbRows->3, NbCols->3, BuilderHeaderRows->(First[#2]&), BuilderHeaderCols->(First[#2]&), ColorBckGrd->GrayLevel[0.5`], ItemStyle->{{Directive[FontFamily->"Helvetica",FontWeight->Bold,FontSize->Medium],None},{Directive[FontFamily->"Helvetica",FontWeight->Bold,FontSize->Medium],None},{{1,1}->Directive[FontSize->Medium],{1,2}->Directive[FontWeight->Bold]}},ItemSize->Full,Alignment->{{Left,Center},{Center,Center}},Dividers->LightGray}; $\endgroup$
    – Trad Dog
    Commented Nov 7, 2015 at 12:36
  • $\begingroup$ Options[DisplayDataset]=Options[DisplayTableWithHeaders]; $\endgroup$
    – Trad Dog
    Commented Nov 7, 2015 at 12:37
  • $\begingroup$ Trad, please add the options into your answer by editing it. $\endgroup$
    – MarcoB
    Commented Nov 12, 2015 at 1:38
  • 1
    $\begingroup$ These functions have been improved since this post. Please refer to my other posts on Dataset.mathematica.stackexchange.com/questions/103464/… $\endgroup$
    – Trad Dog
    Commented Jun 4, 2016 at 10:25

Your Answer

By clicking “Post Your Answer”, you agree to our terms of service and acknowledge you have read our privacy policy.

Not the answer you're looking for? Browse other questions tagged or ask your own question.