11
$\begingroup$

Here is my code

Show[
 Plot[Sin[x], {x, -2 Pi, 2 Pi}, PlotStyle -> Blue],
 Plot[Sign[Sin[x]] Ceiling[Abs[Sin[x]], 1/3], {x, -2 Pi, 2 Pi}, 
  PlotStyle -> Red, Filling -> Axis],
 Plot[Sign[Sin[x]] Floor[Abs[Sin[x]], 1/3], {x, -2 Pi, 2 Pi}, 
  PlotStyle -> Green, Filling -> Axis],
 AspectRatio -> 1/Pi, Frame -> False
 ]

and here is the result,

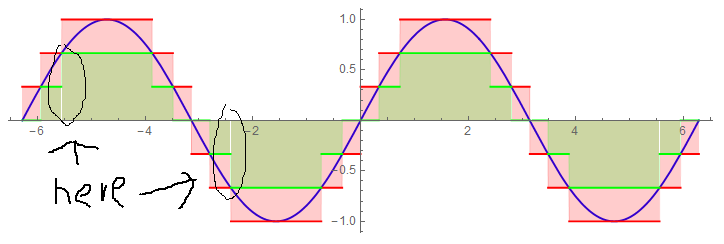
enter image description here As you can see, there are white gaps in the graph, which I want to avoid. Thank you!

$\endgroup$
6
  • $\begingroup$ I have none on v8: i.sstatic.net/E8wV6.png Have you tried playing with Exclusions? $\endgroup$
    – Öskå
    Commented Sep 24, 2014 at 13:48
  • $\begingroup$ @Öskå Yes your graph looks perfect. $\endgroup$
    – Anna Le
    Commented Sep 24, 2014 at 14:01
  • $\begingroup$ @Pickett I don't know why either. I am also using V10. Maybe this is a bug of V10? $\endgroup$
    – Anna Le
    Commented Sep 24, 2014 at 14:04
  • 2
    $\begingroup$ It can be observered on 9.01 too but it depends of the size of the plot. $\endgroup$
    – Kuba
    Commented Sep 24, 2014 at 14:09
  • 1
    $\begingroup$ For me this is a longstanding Mathematica problem. It appears with different types plots as they are resized and the edge positions are not rendered uniformly. I am not aware of any general solution. $\endgroup$
    – Mr.Wizard
    Commented Sep 24, 2014 at 14:37

4 Answers 4

8
$\begingroup$

I had almost the same problem with the original code:

enter image description here

Using Exclusions as Öskå suggested works for me. kguler pointed out that Exclusions -> None is the correct setting to fix this problem:

Show[
 Plot[Sin[x], {x, -2 Pi, 2 Pi}, PlotStyle -> Blue],
 Plot[Sign[Sin[x]] Ceiling[Abs[Sin[x]], 1/3], {x, -2 Pi, 2 Pi}, 
  PlotStyle -> Red, Filling -> Axis, Exclusions -> None], 
 Plot[Sign[Sin[x]] Floor[Abs[Sin[x]], 1/3], {x, -2 Pi, 2 Pi}, 
  PlotStyle -> Green, Filling -> Axis, Exclusions -> None]
 AspectRatio -> 1/Pi, Frame -> False
 ]

enter image description here

$\endgroup$
2
  • $\begingroup$ In version 9.0.1.0 Exclusions->None also works (+1).. $\endgroup$
    – kglr
    Commented Sep 24, 2014 at 14:42
  • $\begingroup$ @kguler Thanks! This setting makes more sense to me, too. $\endgroup$
    – C. E.
    Commented Sep 24, 2014 at 15:00
5
$\begingroup$

This answer is mainly about why there are gaps, and why it may not be a bug ( of Graphics).

First take a look at this example:

Row[
    Plot[Floor[x], {x, 1, 3}, Axes -> False, PlotStyle -> None, 
       Filling -> Axis, PlotRange -> {-1, 3}, ImageSize -> 201, 
       Exclusions -> #] & /@ {True, None}
   ];
Column[{%, % /. Polygon[pts__] :> {EdgeForm[Black], FaceForm[], Polygon[pts]}}]
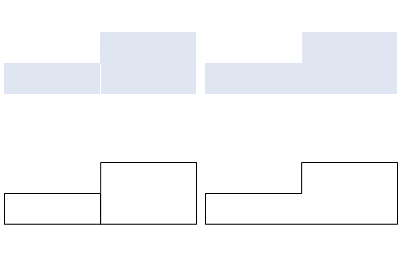
plots with and without Exclusions

It seems an exclusion point will force Plot using seperate Polygons, while Exclusions -> None makes it using a single one. That is why @Pickett 's method works.

Now take a look at the FullForm of the plot with gap, it can be seen that the right most points of the left Polygon have a x-coordinate 1.999362244897959`, which is slightly smaller than that of the left most points of the right Polygon 2.0006377551020407`. So I would say this is a "real" gap (possible deliberately introduced by Exclusions -> True to indicate the (neighbourhood of the) exclusion point) for a (most-of-the-time) good purpose.

To eliminate the gaps, one just need to align the corresponding vertices perfectly. For example:

With[{w = .1, δw = 0.001},
    Graphics[GraphicsComplex[{
                {0, 1}, {0, 0},
                {w, 0}, {w, 1},
                {w + δw, 1}, {w + δw, 0},
                {2 w, 0}, {2 w, 1}
                },
            {
                EdgeForm[],
                FaceForm[RGBColor[0.368417`, 0.506779`, 0.709798`]],
                Polygon[{{1, 2, 3, 4}}], Polygon[{{5, 6, 7, 8}}]
                }
            ]]
    ]

If δw is set to 0, even there are still two Polygons, there won't be any visible gap under any ImageSize. (Tested in MMA 9.0.1 and 10.0.1 on Windows 8.1.)

Now we can see the problem here: those points where gaps happen are discontinuity points of Floor, but they still belong to the function's domain thus should not be excluded. I would say this can be a flaw (or even a bug) of Plot and would be happy if there were an option say Discontinuity -> .... For people who look for more details about this exclusion vs. discontinuity topic, there is a thread on it.
$\endgroup$
4
$\begingroup$

In addition to Pickett's answer using kguler's suggestion about using Exclusions->None, here's a way to avoid using Show:

Plot[{Sin[x], Sign[Sin[x]] Ceiling[Abs[Sin[x]], 1/3], 
  Sign[Sin[x]] Floor[Abs[Sin[x]], 1/3]}, {x, -2 Pi, 2 Pi}, 
 PlotStyle -> {Blue, Red, Green}, 
 Filling -> {2 -> {Axis, LightRed}, 3 -> {Axis, LightBlue}}, 
 AspectRatio -> 1/Pi, Frame -> False, Exclusions -> None]

enter image description here

Instead of separately creating 3 plots of functions over the same interval and then overlaying the graphics, it creates everything using 1 plot. The advantage of this approach is that if you need to change something, you only need to change one thing, rather than 3 things, saving you effort. Michael E2's answer to your previous question also pointed this out, so this is definitely a tip that you should learn, as it'll save you some headaches later, and saves quite a bit of unnecessary typing/formatting.

$\endgroup$
3
$\begingroup$

To get the fine control over the graphics, I would one probably has to construct each element and combine them. As @Silvia points out, exclusions cause separate polygons to be created. When rendered on a discrete screen, these may overlap or have gaps.

That means drawing the step curve and its filling separately, like this:

Plot[Sign[Sin[x]] Ceiling[Abs[Sin[x]], 1/3], {x, -2 Pi, 2 Pi}, 
  PlotStyle -> Red],
Plot[Sign[Sin[x]] Ceiling[Abs[Sin[x]], 1/3], {x, -2 Pi, 2 Pi}, 
  PlotStyle -> None, Filling -> Axis,
  FillingStyle -> Directive[Opacity[0.2], Red], Exclusions -> None]

If you don't want to copy, paste, and edit each step function plot, you could write a function to combine both plots, such as the following:

SetAttributes[plotWithFilling, HoldAll];
plotWithFilling[Plot[f_, x_, opts___], col_] :=
  Show[
   Plot[f, x, PlotStyle -> col, opts],
   Plot[f, x, PlotStyle -> None, Filling -> Axis, 
    FillingStyle -> Directive[Opacity[0.2], col], Exclusions -> None, opts]];

Usage:

Show[
 Plot[Sin[x], {x, -2 Pi, 2 Pi}, PlotStyle -> Blue],
 plotWithFilling[
  Plot[Sign[Sin[x]] Ceiling[Abs[Sin[x]], 1/3], {x, -2 Pi, 2 Pi}],
  Red
  ],
 plotWithFilling[
  Plot[Sign[Sin[x]] Floor[Abs[Sin[x]], 1/3], {x, -2 Pi, 2 Pi}],
  Green
  ],
 AspectRatio -> 1/Pi, Frame -> False]

Mathematica graphics

$\endgroup$

Your Answer

By clicking “Post Your Answer”, you agree to our terms of service and acknowledge you have read our privacy policy.

Not the answer you're looking for? Browse other questions tagged or ask your own question.