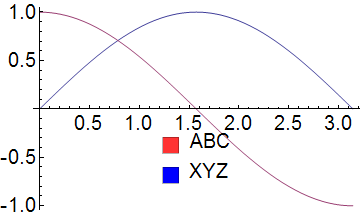
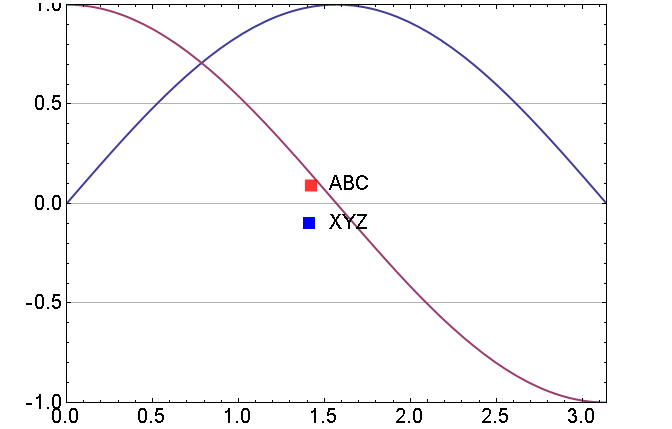
I can confirm the shift occurs even without the special default styling in your plot (version 9).
Your issue stems directly from the use of a special font marker \[FilledSquare] in a PointLegend instead of just using a SwatchLegend. The following does not have the shifting problem.
Plot[{Sin[x], Cos[x]}, {x, 0, Pi},
 PlotLegends -> Placed[SwatchLegend[{Directive[Opacity[0.8], Red], Blue}, {"ABC", "XYZ"}],
 {0.5, 0.3}]]
If you really want to use PointLegend and a square for this, you can use a graphics directive rather than a special character, as shown.
Plot[{Sin[x], Cos[x]}, {x, 0, Pi},
 PlotLegends -> {Placed[
    PointLegend[{Directive[Red, Opacity[0.8]], Blue},
     TextCell[#, TextAlignment -> Left] & /@ {"ABC", "XYZ"},
     LegendMarkerSize -> 13,
     LegendMarkers -> Graphics[{Rectangle[{0, 0}]}]], {0.5, 0.5}]}]
Neither workaround above has the shifting problem.
In any case, I would caution against the use of special characters like \[FilledSquare] as graphics elements. They require the use of the special Mathematica fonts which are not available on all computers and fail badly when exporting as EMF.
As an aside, I'm trying to understand why you need Opacity directives at all. These will not work in EMF export and (because I know what application you are working on ;-) ) are not required by the business.
As a further aside, the use of TextCell stuff isn't necessary to get the style in the legend labels. See, for example:
Plot[{Sin[x], Cos[x]}, {x, 0, Pi},
 BaseStyle -> {FontFamily -> "Arial", FontSize -> 20},
 PlotLegends ->
  Placed[SwatchLegend[{Directive[Opacity[0.8], Red], Blue}, {"ABC",
     "XYZ"}, LegendMarkerSize -> 18,
    LabelStyle ->
     Directive[FontFamily -> "Arial", FontSize -> 20]], {0.5, 0.25}]]

Edit in response to further discussion in comments
Part of the issue here is that the Legend commands by default add a thin border to the legend marker. If this is not wanted, one could either specify EdgeForm[] in the style of the marker, like the first example below, or one could set the BaseStyle to be EdgeForm[] as in the second example. As described in an earlier question and self-answer of mine, BaseStyle does actually work in the various *Legend commands even though the syntax highlighter colors it in red.
Plot[{Sin[x], Cos[x]}, {x, 0, Pi},
 BaseStyle -> {FontFamily -> "Arial", FontSize -> 20},
 PlotLegends -> Placed[SwatchLegend[{Directive[EdgeForm[], Red],
     Directive[EdgeForm[], Blue]}, {"ABC", "XYZ"},
    LegendMarkerSize -> 18,
    LabelStyle -> Directive[EdgeForm[], FontFamily -> "Arial",
      FontSize -> 20]], {0.5, 0.25}]]

Plot[{Sin[x], Cos[x]}, {x, 0, Pi},
 BaseStyle -> {FontFamily -> "Arial", FontSize -> 20},
 PlotLegends ->  Placed[SwatchLegend[{Red, Blue}, {"ABC", "XYZ"},
    BaseStyle -> EdgeForm[], LegendMarkerSize -> 18,
    LabelStyle -> Directive[EdgeForm[], FontFamily -> "Arial",
      FontSize -> 20]], {0.5, 0.25}]]


