2
$\begingroup$

I have a simple graphics which display a polygon and a bar legend. I am having difficulties defining a range of values for my bar legend. What I am looking to get is 4 values: 10^-10, 10^-6, 10^-3, 10^-1 (Green>Amber>Red);

Ultimately I would like to control my polygons color filling using bar legend as a controller. Here is what I have at present:

    Manipulate[
 Row[
  {BarLegend[{{Green, Yellow, Red}, {10^-10, 10^-1}}, 
    LegendLayout -> "Column"], 
   Graphics[
    Polygon[{{-1, 1}, {0, -1}, {1, 1}}, 
     VertexColors -> {Red, Green, Red}], PlotRange -> 1, 
    ImageSize -> {220, 220}]
   }
  ]
 , {{x, .0, "Level:"}, 0, 1, .1, ImageSize -> Medium}, 
 ControlPlacement -> Bottom] (*Controller for filling goes here *)

I was wondering if anyone would be able to help me out to figure out how to set the appropriate range for my BarLegend and perhaps to give me some pointers on how could I achieve filling my Polygon using BarLegend as a control or some similar structure.

Regards,

$\endgroup$

1 Answer 1

4
$\begingroup$

EDIT

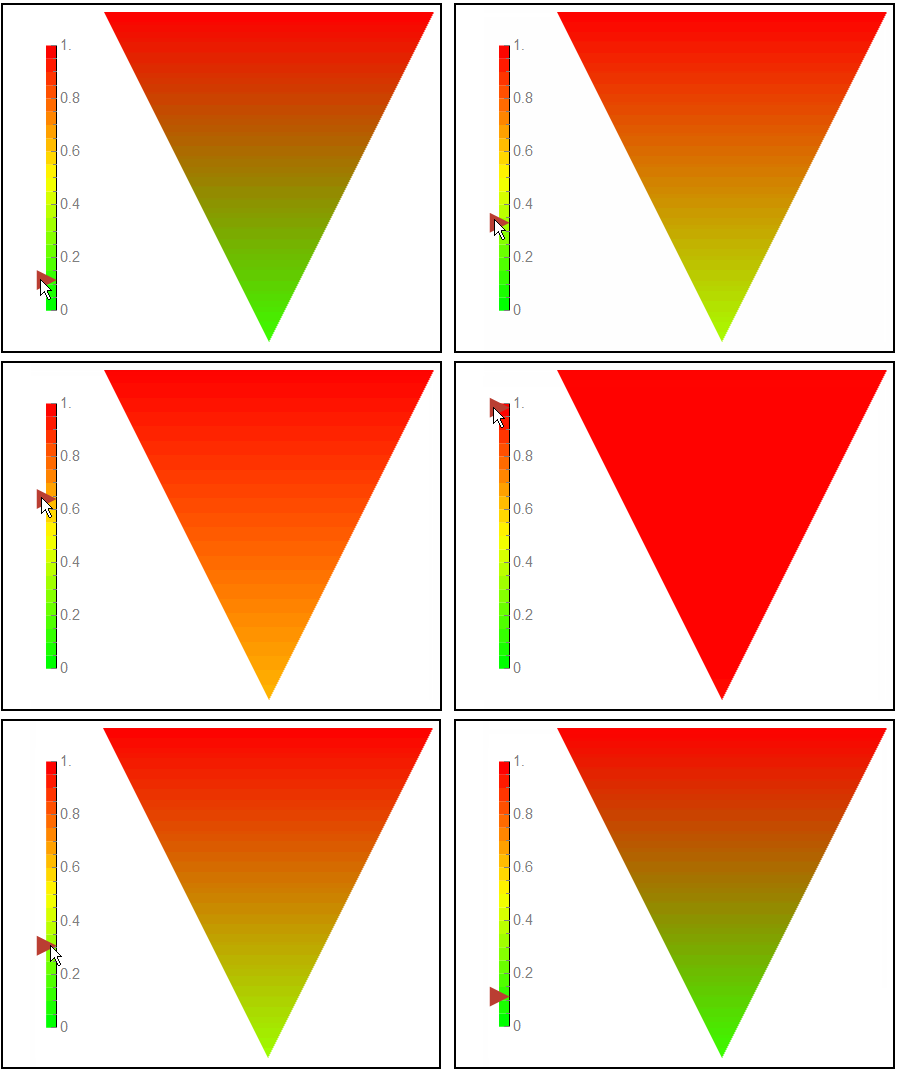
As Mr Wizard observed my original code is not self contained. For reasons that I fail to understand this seemed to work with what seemed a fresh session. The code works if you move the gauge marker but to post correct code (I leave the animated gif as it is the same outcome):

DynamicModule[{s = 0},
 Framed[Row[{VerticalGauge[Dynamic[s], {0, 1}, 
     ScaleRanges -> Partition[Range[0, 1, 0.05], 2, 1], 
     ScaleRangeStyle -> cf], 
    Dynamic@Graphics[
      Polygon[{{-1, 1}, {0, -1}, {1, 1}}, 
       VertexColors -> {Red, cf[s], Red}], PlotRange -> 1, 
      ImageSize -> {220, 220}]}]], 
 Initialization -> (cf[z_] := Blend[{Green, Yellow, Red}, z])]

enter image description here

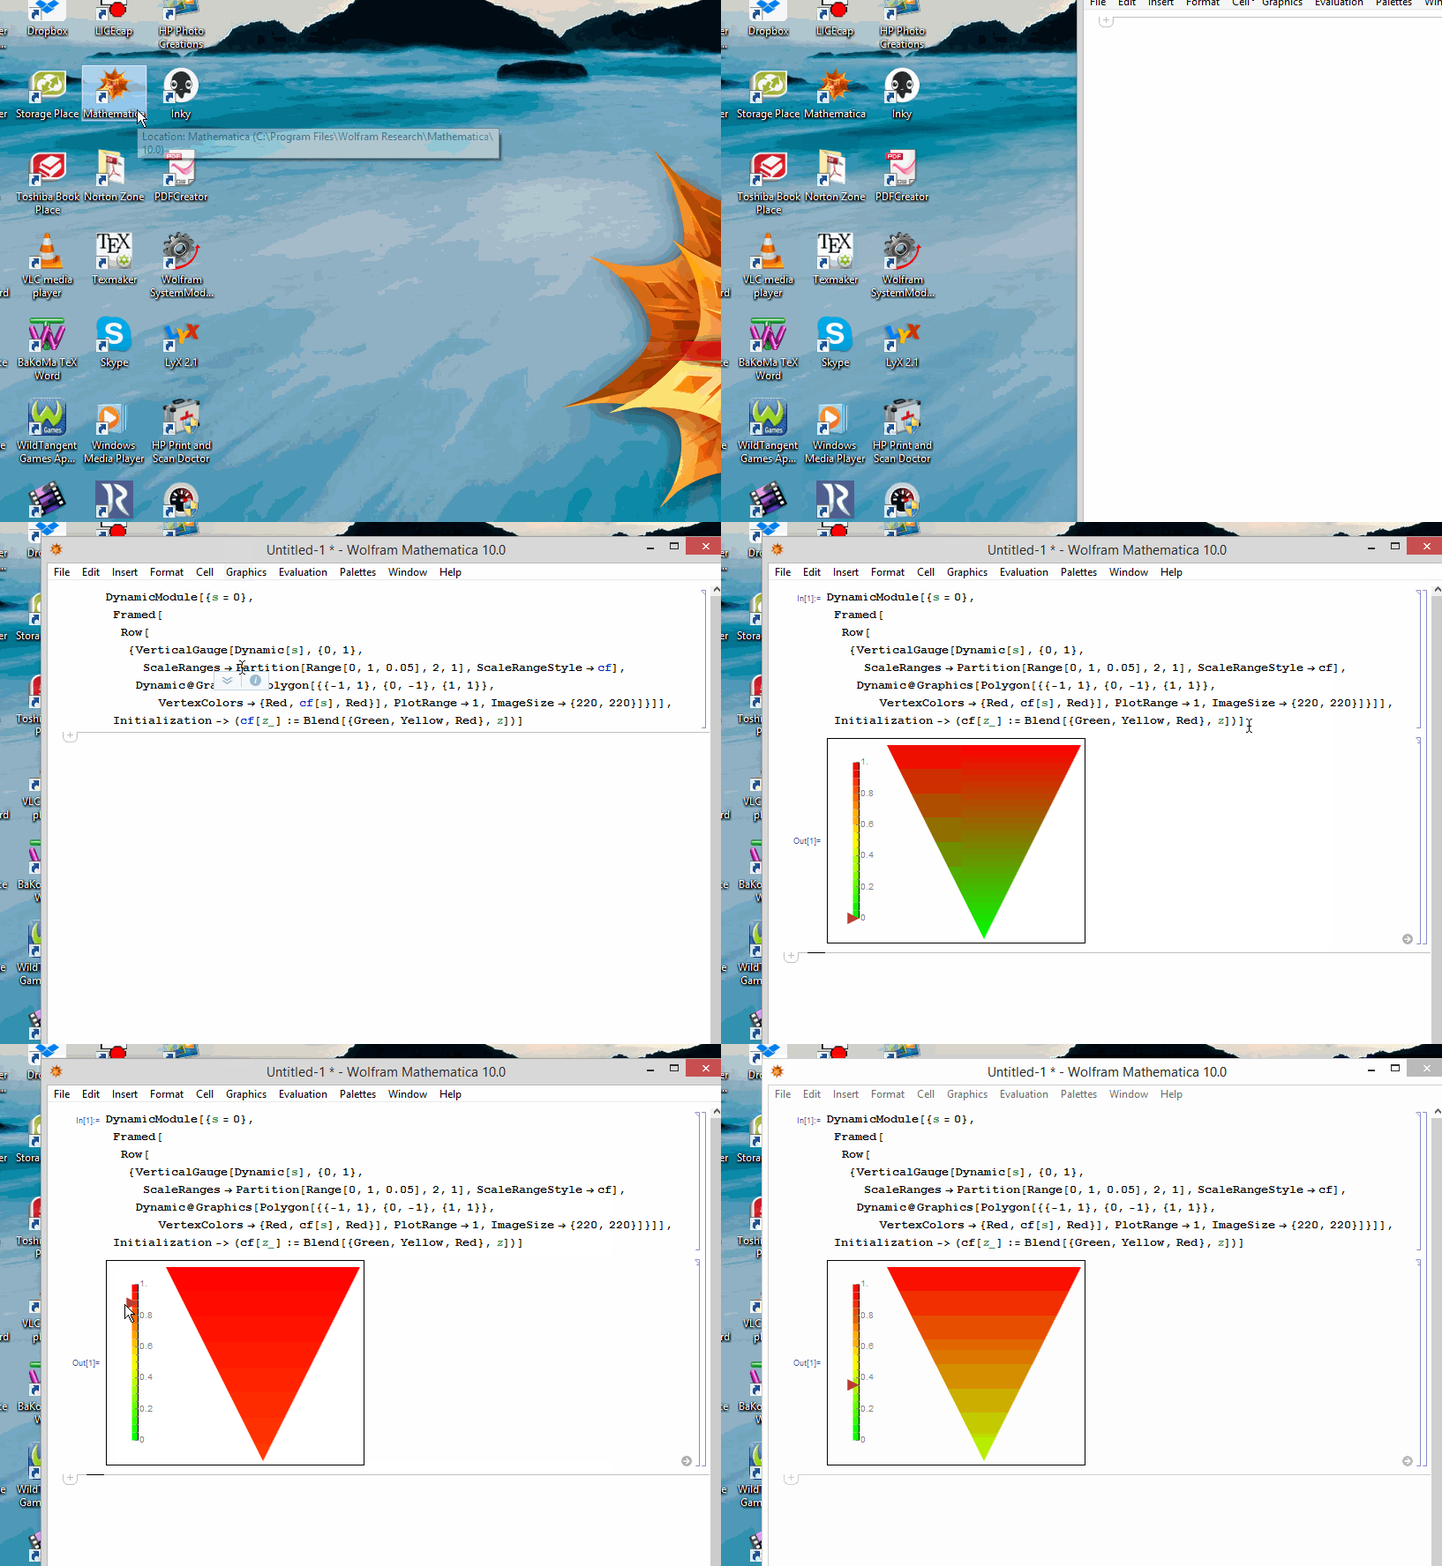
Here is my fresh session:

enter image description here

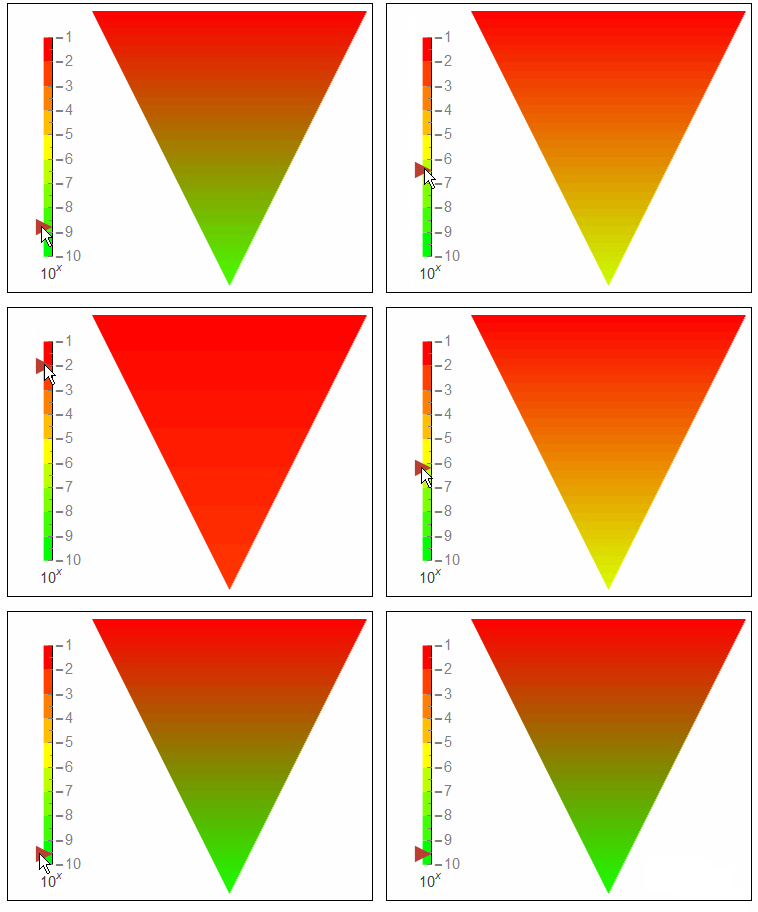
Desired scale The linear gauges are linear scales. The best I could do (without creating a separate gauge) is the following. Note the it appears ScaleRangeFunction uses {0,1} whereas grahic required rescaling.

DynamicModule[{s = -10},
 Framed[Row[{VerticalGauge[Dynamic[s], {-10, -1}, 
     GaugeLabels -> "\!\(\*SuperscriptBox[\(10\), \(x\)]\)", 
     LabelStyle -> 12, 
     ScaleRanges -> Partition[Range[-10, -1, 1], 2, 1], 
     ScaleDivisions -> {10, 2}, ScaleRangeStyle -> cf], 
    Dynamic@Graphics[
      Polygon[{{-1, 1}, {0, -1}, {1, 1}}, 
       VertexColors -> {Red, cf[Rescale[s, {-10, -1}, {0, 1}]], Red}],
       PlotRange -> 1, ImageSize -> {220, 220}]}]], 
 Initialization -> (cf[z_] := Blend[{Green, Yellow, Red}, z])]

enter image description here

$\endgroup$
10
  • $\begingroup$ thank you so much it looks amazing! I was wondering if you could help me with the labels. How would I adjust labels of the barlegend to go from 1x10^-10 to 1x10^-6 then 1x10^3 and finally to 1x10^-1? $\endgroup$ Commented Jul 21, 2014 at 14:06
  • $\begingroup$ @Mr.Wizard hello, I am not sure - but it works! I am a bit of a beginner in Mathematica. $\endgroup$ Commented Jul 21, 2014 at 14:33
  • $\begingroup$ @Mr.Wizard It is self contained. It seems to be one of the nice features of the gauges...I have played with other gauges for other purposes and exploited this...otherwise I cannot comment. $\endgroup$
    – ubpdqn
    Commented Jul 21, 2014 at 14:41
  • $\begingroup$ @ubpdqn how could I adjust the labels in bar legend to values I have mentioned above? :s Many thanks in advance! $\endgroup$ Commented Jul 21, 2014 at 14:44
  • 1
    $\begingroup$ @namelessicecream sorry best I can do with edit $\endgroup$
    – ubpdqn
    Commented Jul 22, 2014 at 9:38

Your Answer

By clicking “Post Your Answer”, you agree to our terms of service and acknowledge you have read our privacy policy.

Not the answer you're looking for? Browse other questions tagged or ask your own question.