Until a cleaner approach is offered, consider the following brute-force method for a partial solution:
ClearAll[newickF];
Needs["HierarchicalClustering`"]
newickF[clstr_] := Fold[Replace[#, #2, {0, Infinity}] &, clstr,
   {Cluster[a_, b_, c_, _, _] :> {{a, c}, {b, c}},
    {{{a_, r_}, {b_, r_}}, t_} :> {{{a, r}, {b, r}}, t - r},
    {{{{a_, r_}, {b : {{_, s_}, {_, s_}}, t_}}, u_} :> {{{a, r}, {b, t}}, u - r},
      {{{b : {{_, s_}, {_, s_}}, t_}, {a_, r_}},  u_} :> {{{b, t}, {a, r}}, u - r}},
    {a_, b_?NumericQ} :> StringJoin[ToString[a], ":", ToString[b]]}]
OP's example:
clusters =  Cluster[Cluster[
  Cluster["a", Cluster["h", "j", 1.52217, 1, 1], 28.8538, 1, 2],
  Cluster[Cluster["c", "e", 10.1371, 1, 1], "d", 22.0063, 2, 1], 47.1129, 3, 3],
  Cluster[Cluster["b", Cluster["g", "i", 2.5374, 1, 1], 5.73533, 1, 2],
   "f", 13.6197, 3, 1], 64.5168, 6, 4];
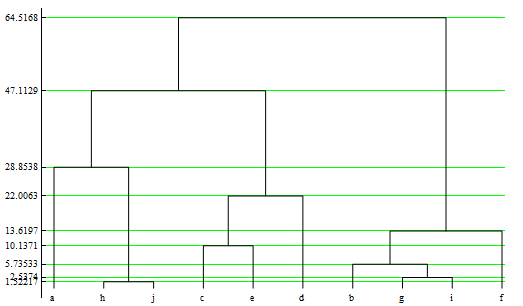
In picture:
dplt1 = DendrogramPlot[clusters, LeafLabels -> (# &),
          GridLines -> {None,
                   tt = Cases[clusters, Cluster[a_, b_, c_, d__] :> c, {0, Infinity}]},
          GridLinesStyle -> Green, ImageSize -> 500, Axes -> {False, True},
          AxesOrigin -> {.75, Automatic}, Ticks -> {Automatic, tt}]
(See Visualize cluster distances in DendrogramPlot)

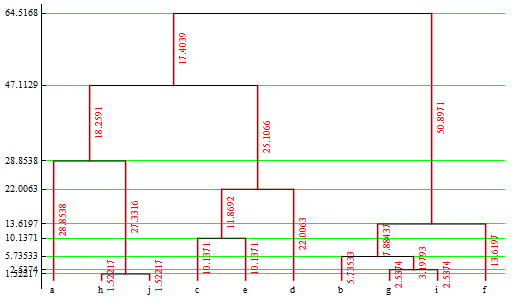
newickF[clusters]
(* {"{{a:28.8538, {h:1.52217, j:1.52217}:27.3316}:18.2591,
     {{c:10.1371, e:10.1371}:11.8692, d:22.0063}:25.1066}:17.4039",
    "{{b:5.73533, {g:2.5374, i:2.5374}:3.19793}:7.88437, f:13.6197}:50.8971"} *)


rule = Line[a : {{x1_, y1_}, {x1_, y2_}, {x2_, z1_}, {x2_, z2_}}] :>
            {Line[a], Directive[Thick, Opacity[.5], Red],
             Line[{{x1, y1}, {x1, y2}}], Line[{{x2, z1}, {x2, z2}}], Opacity[1],
             Text[Abs[y2 - y1], {x1 + .2, (y1 + y2)/2}, Automatic, {0, 1}],
             Text[Abs[z1 - z2], {x2 + .2, (z1 + z2)/2}, Automatic, {0, 1}]}
dplt1 /. rule

Another example:
cl = Agglomerate[N@{1, 2, 10, 12, 3, 14, 15, 20, 26, 25, 27} -> CharacterRange["A", "K"],
      DistanceFunction -> ManhattanDistance, Linkage -> "Centroid"]
(* Cluster[Cluster[Cluster["A", Cluster["B", "E", 1., 1, 1], 1.25, 1, 2],
   Cluster[Cluster["C", "D", 2., 1, 1],
          Cluster["F", "G", 1., 1, 1],  2.75, 2, 2], 9.24306, 3, 4],
   Cluster[Cluster["J", Cluster["K", "I", 1., 1, 1], 1.25, 1, 2],
          "H", 5.55556, 3, 1], 11.9209, 7, 4] *)

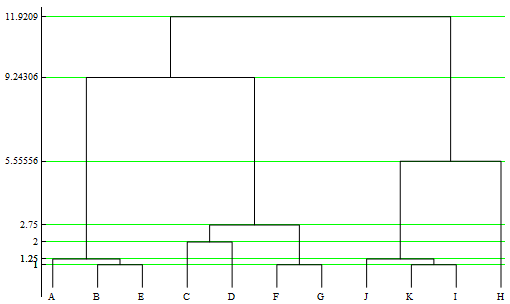
dplt2 = DendrogramPlot[cl, LeafLabels -> (# &),
           GridLines -> {None,
                     tt = Cases[cl,  Cluster[a_, b_, c_, d__] :> c, {0, Infinity}]},
           GridLinesStyle -> Green, ImageSize -> 500, Axes -> {False, True},
           AxesOrigin -> {.75, Automatic}, Ticks -> {Automatic, tt}]

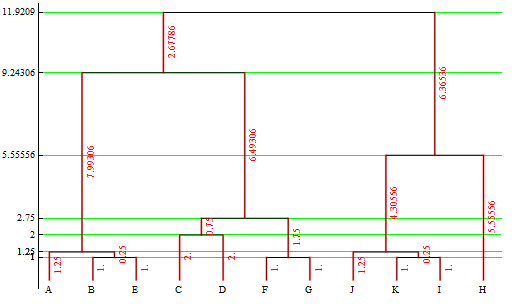
newickF[cl]
(* {"{{A:1.25, {B:1., E:1.}:0.25}:7.99306,
     {{C:2., D:2.}:0.75, {F:1., G:1.}:1.75}:8.49306}:2.67786",
     "{{J:1.25, {K:1., I:1.}:0.25}:4.30556, H:5.55556}:6.36536"} *)

dplt2 /. rule


